It's Science!
I have a 10 year old daughter in the fifth grade. She has participated in the Science Fair almost every year, but this year was different. This year was required participation.
dun … dun … dun …
She and her friend had a really interesting idea on what to do. They wanted to ask the question, “Is Soap and Water the Best Cleaning Method?”
The two Scientists decided that they would test how well the following cleaning agents cleaned a white t-shirt (my white t-shirt actually) after it got dirty:
- Plain Water
- Soap and Water
- Milk
- Almond Milk
While working with them we experimented on how to make the process as scientific as possible. Our first attempt was to just take a picture of the Clean shirt, cut the shirt up and get it dirty. Then we’d try each cleaning agent to see how it went.
It did not go well. It was immediately apparent that there would be no way to test the various cleaning methods efficacy.
No problem. In our second trial we decided to approach it more scientifically.
We would draw 12 equally sized squares on the shirt and take a picture:

We needed 12 squares because we had 4 cleaning methods and 3 trials that needed to be performed
4 Cleaning Methods X 3 Trials = 12 Samples
Next, the Scientists would get the shirt dirty. We then cut out the squares so that we could test cleaning the samples.
Here’s an outline of what the Scientists did to test their hypothesis:
- Take a picture of each piece BEFORE they get dirty
- Get each sample dirty
- Take a picture of each dirty sample
- Clean each sample
- Take a picture of each cleaned sample
- Repeat for each trial
For the ‘Clean Each Sample’ step they placed 1/3 of a cup of the cleaning solution into a small Tupperware tub that could be sealed and vigorously shook for 5 minutes. They had some tired arms at the end.
Once we had performed the experiment we our raw data:
Trial 1
Method Start Dirty Cleaned
Water 

 Soap And Water

 Milk
Milk 

 Almond Milk


Trial 2
Method Start Dirty Cleaned
Water 

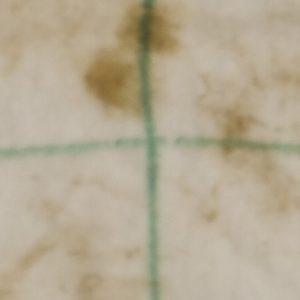 Soap And Water


 Milk
Milk 

 Almond Milk


Trial 3
Method Start Dirty Cleaned
Water 

 Soap And Water

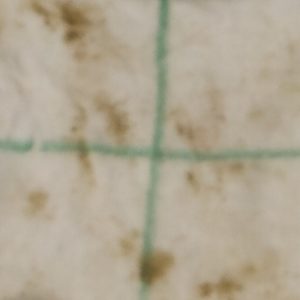 Milk
Milk 

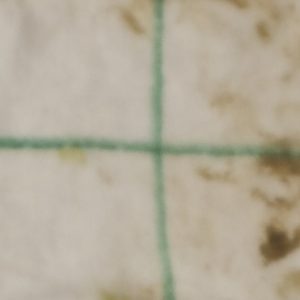 Almond Milk
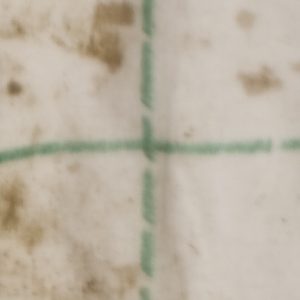

This is great and all, but now what? We can’t really use subjective measures to determine cleanliness and call it science!
My daughter and her friend aren’t coders, but I did explain to them that we needed a more scientific way to determine cleanliness. I suggested that we use python to examine the image and determine the brightness of the image.
We could then use some math to compare the brightness. 1
Now, onto the code!
OK, let’s import some libraries:
from PIL import Image, ImageStat
import math
import glob
import pandas as pd
import matplotlib.pyplot as plt
There are 2 functions to determine brightness that I found here. They were super useful for this project. As an aside, I love StackOverflow!
#Convert image to greyscale, return average pixel brightness.
def brightness01( im_file ):
   im = Image.open(im_file).convert('L')
   stat = ImageStat.Stat(im)
   return stat.mean[0]

#Convert image to greyscale, return RMS pixel brightness.
def brightness02( im_file ):
   im = Image.open(im_file).convert('L')
   stat = ImageStat.Stat(im)
   return stat.rms[0]
The next block of code takes the images and processes them to get the return the brightness levels (both of them) and return them to a DataFrame to be used to write to a csv file.
I named the files in such a way so that I could automate this. It was a bit tedious (and I did have the scientists help) but they were struggling to understand why we were doing what we were doing. Turns out teaching CS concepts is harder than it looks.
f = []
img_brightness01 = []
img_brightness02 = []
trial = []
state = []
method = []
for filename in glob.glob('/Users/Ryan/Dropbox/Abby/Science project 2016/cropped images/**/*', recursive=True):
    f.append(filename.split('/')[-1])
    img_brightness01.append(round(brightness01(filename),0))
    img_brightness02.append(round(brightness02(filename),0))
for part in f:
    trial.append(part.split('_')[0])
    state.append(part.split('_')[1])
    method.append(part.split('_')[2].replace('.png', '').replace('.jpg',''))

dic = {'TrialNumber': trial, 'SampleState': state, 'CleaningMethod': method, 'BrightnessLevel01': img_brightness01, 'BrightnessLevel02': img_brightness02}

results = pd.DataFrame(dic)
I’m writing the output to a csv file here so that the scientist will have their data to make their graphs. This is where my help with them ended.
#write to a csv file
results.to_csv('/Users/Ryan/Dropbox/Abby/Science project 2016/results.csv')
Something I wanted to do though was to see what our options were in python for creating graphs. Part of the reason this wasn’t included with the science project is that we were on a time crunch and it was easier for the Scientists to use Google Docs to create their charts, and part of it was that I didn’t want to cheat them out of creating the charts on their own.
There is a formula below to determine a score which is given by a normalized percentage that was used by them, but the graphing portion below I did after the project was turned in.
Let’s get the setup out of the way:
#Create Bar Charts
trials = ['Trial1','Trial2','Trial3']

n_trials = len(trials)
index = np.arange(n_trials)
bar_width = 0.25
bar_buffer = 0.05
opacity = 0.4

graph_color = ['b', 'r', 'g', 'k']
methods = ['Water', 'SoapAndWater', 'Milk', 'AlmondMilk']

graph_data = []
Now, let’s loop through each cleaning method and generate a list of scores (where one score is for one trial)
for singlemethod in methods:
    score= []
    for trialnumber in trials:
        s = results.loc[results['CleaningMethod'] == singlemethod].loc[results['TrialNumber'] == trialnumber].loc[results['SampleState'] == 'Start'][['BrightnessLevel01']]
        s = list(s.values.flatten())[0]
        d = results.loc[results['CleaningMethod'] == singlemethod].loc[results['TrialNumber'] == trialnumber].loc[results['SampleState'] == 'Dirty'][['BrightnessLevel01']]
        d = list(d.values.flatten())[0]
        c = results.loc[results['CleaningMethod'] == singlemethod].loc[results['TrialNumber'] == trialnumber].loc[results['SampleState'] == 'Clean'][['BrightnessLevel01']]
        c = list(c.values.flatten())[0]
        scorepct =  float((c-d) / (s - d))
        score.append(scorepct)
    graph_data.append(score)
This last section was what stumped me for the longest time. I had such a mental block converting from iterating over items in a list to item counts of a list. After much Googling I was finally able to make the breakthrough I needed and found the idea of looping through a range and everything came together:
for i in range(0, len(graph_data)):
    plt.bar(index+ (bar_width)*i, graph_data[i], bar_width-.05, alpha=opacity,color=graph_color[i],label=methods[i])
    plt.xlabel('Trial Number')
    plt.axvline(x=i-.025, color='k', linestyle='--')
    plt.xticks(index+bar_width*2, trials)
    plt.yticks((-1,-.75, -.5, -.25, 0,0.25, 0.5, 0.75, 1))
    plt.ylabel('Brightness Percent Score')
    plt.title('Comparative Brightness Scores')
    plt.legend(loc=3)
The final output of this code gives:

From the graph you can see the results are … inconclusive. I’m not sure what the heck happened in Trial 3 but the Scientists were able to make the samples dirtier. Ignoring Trial 3 there is no clear winner in either Trial 1 or Trial 2.
I think it would have been interesting to have 30 - 45 trials and tested this with a some statistics, but that’s just me wanting to show something to be statistically valid.
I think the best part of all of this was the time I got to spend with my daughter and the thinking through the experiment. I think she and her friend learned a bit more about the scientific method (and hey, isn’t that what this type of thing is all about?).
I was also really excited when her friend said, “Science is pretty cool” and then had a big smile on her face.
They didn’t go onto district, or get a blue ribbon, but they won in that they learned how neat science can be.
- [The score is the ratio of how clean the cleaning method was able to get the sample compared to where it started, i.e. the ratio of the difference of the
cleanedsample and thedirtysample to the difference of thestartingsample and thedirtysample. ↩︎
Keeping track of which movies I want to watch
One thing I like to do with my family is watch movies. But not just any movies, Comic Book movies. We've seen both Thor and Thor: The Dark World, Iron Man and Guardians of the Galaxy. It's not a lot, but we're working on it.
I've mapped out the Marvel Cinematic Universe movies for us to watch, and it's OK, but there wasn't a easy way to link into the iTunes store from the list.
I decided that I could probably use Workflow to do this, but I hadn't really worked with it to do it, but today I had a bit of time and figured, "what they heck ... why not?"
My initial attempt was clunky. It required to workflows to accomplish what I needed. This was because I had to split the work of Workflow into 2 workflows:
- Get the Name
- Get the Link
Turns out there's a much easier way, so I'll post the link to that workflow, and not the workflows that are much harder to use!
The workflow Add Movie to Watch accepts iTunes products. The workflow then does the following:
- It saves the
iTunes productsURL as a variable callediTunes - It then gets the
iTunesvariable to retrieve theNameand sets the value to a variable calledMovie - Next it asks 'Who is the movie being added by?' This is important for my family as we want a common list, but it's also good to know who added the movie!
- This value is saved to a variable called
User - Finally, I want to know when the movie was added so I get the current date.
We take all of the items and construct a bit of text that looks like this:
[{Movie}]({iTunes}) - Added on {Input} by {User}
Where each of the words above surrounded by the {} are the variable names previously mentioned ({Input} is from the get current date and doesn't need to be saved to a variable).
In my last step I take this text and append it to a file in Dropbox called Movies to Watch.md.
It took way longer than I would have liked to finish this up, but at the end of the day, I'm glad that I was able to get it done.
Web Scrapping - Passer Data (Part III)
In Part III I'm reviewing the code to populate a DataFrame with Passer data from the current NFL season.
To start I use the games DataFrame I created in Part II to create 4 new DataFrames:
- reg_season_games - All of the Regular Season Games
- pre_season_games - All of the Pre Season Games
- gameshome - The Home Games
- gamesaway - The Away Games
A cool aspect of the DataFrames is that you can treat them kind of like temporary tables (at least, this is how I'm thinking about them as I am mostly a SQL programmer) and create other temporary tables based on criteria. In the code below I'm taking the nfl_start_date that I defined in Part II as a way to split the data frame into pre / and regular season DataFrame. I then take the regular season DataFrame and split that into home and away DataFrames. I do this so I don't double count the statistics for the passers.
#Start Section 3

reg_season_games = games.loc[games['match_date'] >= nfl_start_date]
pre_season_games = games.loc[games['match_date'] < nfl_start_date]

gameshome = reg_season_games.loc[reg_season_games['ha_ind'] == 'vs']
gamesaway = reg_season_games.loc[reg_season_games['ha_ind'] == '@']
Next, I set up some variables to be used later:
BASE_URL = 'http://www.espn.com/nfl/boxscore/_/gameId/{0}'

#Create the lists to hold the values for the games for the passers
player_pass_name = []
player_pass_catch = []
player_pass_attempt = []
player_pass_yds = []
player_pass_avg = []
player_pass_td = []
player_pass_int = []
player_pass_sacks = []
player_pass_sacks_yds_lost = []
player_pass_rtg = []
player_pass_week_id = []
player_pass_result = []
player_pass_team = []
player_pass_ha_ind = []
player_match_id = []
player_id = [] #declare the player_id as a list so it doesn't get set to a str by the loop below

headers_pass = ['match_id', 'id', 'Name', 'CATCHES','ATTEMPTS', 'YDS', 'AVG', 'TD', 'INT', 'SACKS', 'YRDLSTSACKS', 'RTG']
Now it's time to start populating some of the list variables I created above. I am taking the week_id, result, team_x, and ha_ind columns from the games DataFrame (I'm sure there is a better way to do this, and I will need to revisit it in the future)
player_pass_week_id.append(gamesaway.week_id)
player_pass_result.append(gamesaway.result)
player_pass_team.append(gamesaway.team_x)
player_pass_ha_ind.append(gamesaway.ha_ind)
Now for the looping (everybody's favorite part!). Using BeautifulSoup I get the div of class col column-one gamepackage-away-wrap. Once I have that I get the table rows and then loop through the data in the row to get what I need from the table holding the passer data. Some interesting things happening below:
- The Catches / Attempts and Sacks / Yrds Lost are displayed as a single column each (even though each column holds 2 statistics). In order to fix this I use the
index()method and get all of the data to the left of a character (-and/respectively for each column previously mentioned) and append the resulting 2 items per column (so four in total) to 2 different lists (four in total).
The last line of code gets the ESPN player_id, just in case I need/want to use it later.
for index, row in gamesaway.iterrows():
    print(index)
    try:
        request = requests.get(BASE_URL.format(index))
        table_pass = BeautifulSoup(request.text, 'lxml').find_all('div', class_='col column-one gamepackage-away-wrap')

        pass_ = table_pass[0]
        player_pass_all = pass_.find_all('tr')


        for tr in player_pass_all:
            for td in tr.find_all('td', class_='sacks'):
                for t in tr.find_all('td', class_='name'):
                    if t.text != 'TEAM':
                        player_pass_sacks.append(int(td.text[0:td.text.index('-')]))
                        player_pass_sacks_yds_lost.append(int(td.text[td.text.index('-')+1:]))
            for td in tr.find_all('td', class_='c-att'):
                for t in tr.find_all('td', class_='name'):
                    if t.text != 'TEAM':
                        player_pass_catch.append(int(td.text[0:td.text.index('/')]))
                        player_pass_attempt.append(int(td.text[td.text.index('/')+1:]))
            for td in tr.find_all('td', class_='name'):
                for t in tr.find_all('td', class_='name'):
                    for s in t.find_all('span', class_=''):
                        if t.text != 'TEAM':
                            player_pass_name.append(s.text)
            for td in tr.find_all('td', class_='yds'):
                for t in tr.find_all('td', class_='name'):
                    if t.text != 'TEAM':
                        player_pass_yds.append(int(td.text))
            for td in tr.find_all('td', class_='avg'):
                for t in tr.find_all('td', class_='name'):
                    if t.text != 'TEAM':
                        player_pass_avg.append(float(td.text))
            for td in tr.find_all('td', class_='td'):
                for t in tr.find_all('td', class_='name'):
                    if t.text != 'TEAM':
                        player_pass_td.append(int(td.text))
            for td in tr.find_all('td', class_='int'):
                for t in tr.find_all('td', class_='name'):
                    if t.text != 'TEAM':
                        player_pass_int.append(int(td.text))
            for td in tr.find_all('td', class_='rtg'):
                for t in tr.find_all('td', class_='name'):
                    if t.text != 'TEAM':
                        player_pass_rtg.append(float(td.text))
                        player_match_id.append(index)
            #The code below cycles through the passers and gets their ESPN Player ID
            for a in tr.find_all('a', href=True):
                player_id.append(a['href'].replace("http://www.espn.com/nfl/player/_/id/","")[0:a['href'].replace("http://www.espn.com/nfl/player/_/id/","").index('/')])

    except Exception as e:
        pass
With all of the data from above we now populate our DataFrame using specific headers (that's why we set the headers_pass variable above):
player_passer_data = pd.DataFrame(np.column_stack((
player_match_id,
player_id,
player_pass_name,
player_pass_catch,
player_pass_attempt,
player_pass_yds,
player_pass_avg,
player_pass_td,
player_pass_int,
player_pass_sacks,
player_pass_sacks_yds_lost,
player_pass_rtg
)), columns=headers_pass)
An issue that I ran into as I was playing with the generated DataFrame was that even though I had set the numbers generated in the for loop above to be of type int anytime I would do something like a sum() on the DataFrame the numbers would be concatenated as though they were strings (because they were!).
After much Googling I came across a useful answer on StackExchange (where else would I find it, right?)
What it does is to set the data type of the columns from string to int
player_passer_data[['TD', 'CATCHES', 'ATTEMPTS', 'YDS', 'INT', 'SACKS', 'YRDLSTSACKS','AVG','RTG']] = player_passer_data[['TD', 'CATCHES', 'ATTEMPTS', 'YDS', 'INT', 'SACKS', 'YRDLSTSACKS','AVG','RTG']].apply(pd.to_numeric)
OK, so I've got a DataFrame with passer data, I've got a DataFrame with away game data, now I need to join them. As expected, pandas has a way to join DataFrame data ... with the join method obviously!
I create a new DataFrame called game_passer_data which joins player_passer_data with games_away on their common key match_id. I then have to use set_index to make sure that the index stays set to match_id ... If I don't then the index is reset to an auto-incremented integer.
game_passer_data = player_passer_data.join(gamesaway, on='match_id').set_index('match_id')
This is great, but now game_passer_data has all of these extra columns. Below is the result of running game_passer_data.head() from the terminal:
id Name CATCHES ATTEMPTS YDS AVG TD INT SACKS
match_id 400874518 2577417 Dak Prescott 22 30 292 9.7 0 0 4 400874674 2577417 Dak Prescott 23 32 245 7.7 2 0 2 400874733 2577417 Dak Prescott 18 27 247 9.1 3 1 2 400874599 2577417 Dak Prescott 21 27 247 9.1 3 0 0 400874599 12482 Mark Sanchez 1 1 8 8.0 0 0 0
YRDLSTSACKS ...
match_id ... 400874518 14 ... 400874674 11 ... 400874733 14 ... 400874599 0 ... 400874599 0 ...
ha_ind match_date opp result team_x
match_id 400874518 @ 2016-09-18 washington-redskins W Dallas Cowboys 400874674 @ 2016-10-02 san-francisco-49ers W Dallas Cowboys 400874733 @ 2016-10-16 green-bay-packers W Dallas Cowboys 400874599 @ 2016-11-06 cleveland-browns W Dallas Cowboys 400874599 @ 2016-11-06 cleveland-browns W Dallas Cowboys
week_id prefix_1 prefix_2 team_y
match_id 400874518 2 wsh washington-redskins Washington Redskins 400874674 4 sf san-francisco-49ers San Francisco 49ers 400874733 6 gb green-bay-packers Green Bay Packers 400874599 9 cle cleveland-browns Cleveland Browns 400874599 9 cle cleveland-browns Cleveland Browns
                                                         url
match_id
400874518  http://www.espn.com/nfl/team/_/name/wsh/washin...
400874674  http://www.espn.com/nfl/team/_/name/sf/san-fra...
400874733  http://www.espn.com/nfl/team/_/name/gb/green-b...
400874599  http://www.espn.com/nfl/team/_/name/cle/clevel...
400874599  http://www.espn.com/nfl/team/_/name/cle/clevel...
That is nice, but not exactly what I want. In order to remove the extra columns I use the drop method which takes 2 arguments:
- what object to drop
- an axis which determine what types of object to drop (0 = rows, 1 = columns):
Below, the object I define is a list of columns (figured that part all out on my own as the documentation didn't explicitly state I could use a list, but I figured, what's the worst that could happen?)
game_passer_data = game_passer_data.drop(['opp', 'prefix_1', 'prefix_2', 'url'], 1)
Which gives me this:
id Name CATCHES ATTEMPTS YDS AVG TD INT SACKS
match_id 400874518 2577417 Dak Prescott 22 30 292 9.7 0 0 4 400874674 2577417 Dak Prescott 23 32 245 7.7 2 0 2 400874733 2577417 Dak Prescott 18 27 247 9.1 3 1 2 400874599 2577417 Dak Prescott 21 27 247 9.1 3 0 0 400874599 12482 Mark Sanchez 1 1 8 8.0 0 0 0
YRDLSTSACKS RTG ha_ind match_date result team_x
match_id 400874518 14 103.8 @ 2016-09-18 W Dallas Cowboys 400874674 11 114.7 @ 2016-10-02 W Dallas Cowboys 400874733 14 117.4 @ 2016-10-16 W Dallas Cowboys 400874599 0 141.8 @ 2016-11-06 W Dallas Cowboys 400874599 0 100.0 @ 2016-11-06 W Dallas Cowboys
          week_id               team_y
match_id
400874518       2  Washington Redskins
400874674       4  San Francisco 49ers
400874733       6    Green Bay Packers
400874599       9     Cleveland Browns
400874599       9     Cleveland Browns
I finally have a DataFrame with the data I care about, BUT all of the column names are wonky!
This is easy enough to fix (and should have probably been fixed earlier with some of the objects I created only containing the necessary columns, but I can fix that later). By simply renaming the columns as below:
game_passer_data.columns = ['id', 'Name', 'Catches', 'Attempts', 'YDS', 'Avg', 'TD', 'INT', 'Sacks', 'Yards_Lost_Sacks', 'Rating', 'HA_Ind', 'game_date', 'Result', 'Team', 'Week', 'Opponent']
I now get the data I want, with column names to match!
id Name Catches Attempts YDS Avg TD INT Sacks
match_id 400874518 2577417 Dak Prescott 22 30 292 9.7 0 0 4 400874674 2577417 Dak Prescott 23 32 245 7.7 2 0 2 400874733 2577417 Dak Prescott 18 27 247 9.1 3 1 2 400874599 2577417 Dak Prescott 21 27 247 9.1 3 0 0 400874599 12482 Mark Sanchez 1 1 8 8.0 0 0 0
Yards_Lost_Sacks Rating HA_Ind game_date Result Team
match_id 400874518 14 103.8 @ 2016-09-18 W Dallas Cowboys 400874674 11 114.7 @ 2016-10-02 W Dallas Cowboys 400874733 14 117.4 @ 2016-10-16 W Dallas Cowboys 400874599 0 141.8 @ 2016-11-06 W Dallas Cowboys 400874599 0 100.0 @ 2016-11-06 W Dallas Cowboys
          Week             Opponent
match_id
400874518    2  Washington Redskins
400874674    4  San Francisco 49ers
400874733    6    Green Bay Packers
400874599    9     Cleveland Browns
400874599    9     Cleveland Browns
I've posted the code for all three parts to my GitHub Repo.
Work that I still need to do:
- Add code to get the home game data
- Add code to get data for the other position players
- Add code to get data for the defense
When I started this project on Wednesday I had only a bit of exposure to very basic aspects of Python and my background as a developer. I'm still a long way from considering myself proficient in Python but I know more now that I did 3 days ago and for that I'm pretty excited! It's also given my an ~~excuse~~ reason to write some stuff which is a nice side effect.
Web Scrapping - Passer Data (Part II)
On a previous post I went through my new found love of Fantasy Football and the rationale behind the 'why' of this particular project. This included getting the team names and their URLs from the ESPN website.
As before, let's set up some basic infrastructure to be used later:
from time import strptime

year = 2016 # allows us to change the year that we are interested in.
nfl_start_date = date(2016, 9, 8)
BASE_URL = 'http://espn.go.com/nfl/team/schedule/_/name/{0}/year/{1}/{2}' #URL that we'll use to cycle through to get the gameid's (called match_id)

match_id = []
week_id = []
week_date = []
match_result = []
ha_ind = []
team_list = []
Next, we iterate through the teams dictionary that I created yesterday:
for index, row in teams.iterrows():
    _team, url = row['team'], row['url']
    r=requests.get(BASE_URL.format(row['prefix_1'], year, row['prefix_2']))
    table = BeautifulSoup(r.text, 'lxml').table
    for row in table.find_all('tr')[2:]: # Remove header
        columns = row.find_all('td')
        try:
            for result in columns[3].find('li'):
                match_result.append(result.text)
                week_id.append(columns[0].text) #get the week_id for the games dictionary so I know what week everything happened
                _date = date(
                    year,
                    int(strptime(columns[1].text.split(' ')[1], '%b').tm_mon),
                    int(columns[1].text.split(' ')[2])
                )
                week_date.append(_date)
                team_list.append(_team)
                for ha in columns[2].find_all('li', class_="game-status"):
                    ha_ind.append(ha.text)
            for link in columns[3].find_all('a'): # I realized here that I didn't need to do the fancy thing from the site I was mimicking http://danielfrg.com/blog/2013/04/01/nba-scraping-data/
                match_id.append(link.get('href')[-9:])

        except Exception as e:
            pass
Again, we set up some variables to be used in the for loop. But I want to really talk about the try portion of my code and the part where the week_date is being calculated.
Although I've been developing and managing developers for a while, I've not had the need to use a construct like try. (I know, right, weird!)
The basic premise of the try is that it will execute some code and if it succeeds that code will be executed. If not, it will go to the exception portion. For Python (and maybe other languages, I'm not sure) the exception MUST have something in it. In this case, I use Python's pass function, which basically says, 'hey, just forget about doing anything'. I'm not raising any errors here because I don't care if the result is 'bad' I just want to ignore it because there isn't any data I can use.
The other interesting (or gigantic pain in the a\$\$) thing is that the way ESPN displays dates on the schedule page is as Day of Week, Month Day, i.e. Sun Sep 11. There is no year. I think this is because for the most part the regular season for an NFL is always in the same calendar year. However, this year the last game of the season, in week 17, is in January. Since I'm only getting games that have been played, I'm safe for a couple more weeks, but this will need to be addressed, otherwise the date of the last games of the 2016 season will show as January 2016, instead of January 2017.
Anyway, I digress. In order to change the displayed date to a date I can actually use is I had to get the necessary function. In order to get that I had to add the following line to my code from yesterday
from time import strptime
This allows me to make some changes to the date (see where _date is being calculated in for result in columns[3].find('li'): portion of the try:.
One of the things that confused the heck out of me initially was the way the date is being stored in the list week_date. It is in the form datetime.date(2016, 9, 1), but I was expecting it to be stored as 2016-09-01. I did a couple of things to try and fix this, especially because once the list was added to the gamesdic dictionary and then used in the games DataFrame the week_date was then stored as 1472688000000 which is the milliseconds since Jan 1, 1970 to the date of the game, but it took an embarising amount of Googling to ~~realize~~ discover this.
With this new discovery, I forged on. The last two things that I needed to do was to create a dictionary to hold my data with all of my columns:
gamesdic = {'match_id': match_id, 'week_id': week_id, 'result': match_result, 'ha_ind': ha_ind, 'team': team_list, 'match_date': week_date}
With dictionary in hand I was able to create a DataFrame:
games = pd.DataFrame(gamesdic).set_index('match_id')
The line above is frighteningly simple. It's basically saying, hey, take all of the data from the gamesdic dictionary and make the match_id the index.
To get the first part, see my post Web Scrapping - Passer Data (Part I).
Converting Writing Examples from doc to markdown: My Process
Converting Writing Examples from doc to markdown: My Process
All of my writing examples were written while attending the University of Arizona when I was studying Economics.
These writing examples are from 2004 and were written in either Microsoft Word OR the OpenOffice Writer
Before getting the files onto Github I wanted to convert them into markdown so that they would be in plain text.
I did this mostly as an exercise to see if I could, but in going through it I'm glad I did. Since the files were written in .doc format, and the .doc format has been replaced with the .docx format it could be that at some point my work would be inaccessible. Now, I don't have to worry about that.
So, how did I get from a .doc file written in 2004 to a converted markdown file created in 2016? Here's how:
Round 1
- Downloaded the Doc files from my Google Drive to my local Desktop and saved them into a folder called
Summaries - Each week of work had it's own directory, so I had to go into each directory individually (not sure how to do recursive work yet)
- Each of the files was written in 2004 so I had to change the file types from .doc to .docx. This was accomplished with this command:
textutil -convert docx *.doc - Once the files were converted from .doc to .docx I ran the following commands:
cd ../yyyymmddwhere yyyy = YEAR, mm = Month in 2 digits; dd = day in 2 digitsfor f in *\ *; do mv "$f" "${f// /_}"; done\^1- this would replace the space character with an underscore. this was needed so I could run the next commandfor file in $(ls *.docx); do pandoc -s -S "${file}" -o "${file%docx}md"; done\^2 - this uses pandoc to convert the docx file into valid markdown filesmv *.md ../- used to move the .md files into the next directory up
- With that done I just needed to move the files from my
Summariesdirectory to mywriting-examplesgithub repo. I'm using the GUI for this so I have a folder on my desktop calledwriting-examples. To move them I just usedmv Summaries/*.md writing-examples/
So that's it. Nothing too fancy, but I wanted to write it down so I can look back on it later and know what the heck I did.
Round 2
The problem I'm finding is that the bulk conversion using textutil isn't keeping the footnotes from the original .doc file. These are important though, as they reference the original work. Ugh!
Used this command \^5 to recursively replace the spaces in the files names with underscores:
find . -depth -name '* *' \ | while IFS= read -r f ; do mv -i "$f" "$(dirname "$f")/$(basename "$f"|tr ' ' _)" ; done
Used this command \^3 to convert all of the .doc to .docx at the same time
find . -name *.doc -exec textutil -convert docx '{}' \;
Used this command \^4 to generate the markdown files recursively:
find . -name "*.docx" | while read i; do pandoc -f docx -t markdown "$i" -o "${i%.*}.md"; done;
Used this command to move the markdown files:
Never figured out what to do here :(
Round 3
OK, I just gave up on using textutil for the conversion. It wasn't keeping the footnotes on the conversion from .doc to .docx.
Instead I used the Google Drive add in Converter for Google Drive Document. It converted the .doc to .docx AND kept the footnotes like I wanted it to.
Of course, it output all of the files to the same directory, so the work I did to get the recursion to work previously can't be applied here sigh
Now, the only commands to run from the terminal are the following:
1. `for f in *\ *; do mv "$f" "${f// /_}"; done` [^1]- this would replace the space character with an underscore. this was needed so I could run the next command
2. `for file in $(ls *.docx); do pandoc -s -S "${file}" -o "${file%docx}md"; done` [^2] - this uses pandoc to convert the docx file into valid markdown files
3. `mv *.md <directory/path>`
Round 4
Like any ~~good~~ ~~bad~~ lazy programmer I've opted for a brute force method of converting the doc files to docx files. I opened each one in Word on macOS and saved as docx. Problem solved ¯_(ツ)_/¯
Step 1: used the command I found here \^7 to recursively replace the spaces in the files names with underscores _
find . -depth -name '* *' \| while IFS= read -r f ; do mv -i "$f" "$(dirname "$f")/$(basename "$f"|tr ' ' _)" ; done
Step 2: Use the command found here \^6 to generate the markdown files recursively:
find . -name "*.docx" | while read i; do pandoc -f docx -t markdown "$i" -o "${i%.*}.md"; done;
Step 3: Add the files to my GitHub repo graduate-writing-examples
For this I used the GitHub macOS Desktop App to create a repo in my Documents directory, so it lives in ~/Documents/graduate-writing-examples/
I then used the finder to locate all of the md files in the Summaries folder and then dragged them into the repo. There were 2 files with the same name Rose_Summary and Libecap_and_Johnson_Summary. While I'm sure that I could have figured out how to accomplish this with the command line, this took less than 1 minute, and I had just spent 5 minutes trying to find a terminal command to do it. Again, the lazy programmer wins.
Once the files were in the local repo I committed the files and boom they were in my GitHub Writing Examples repo.
Vin's Last Game
Twelve years ago today Steve Finley hit a Grand Slam in the 9th to clinch the NL West title against the Giants. Today, the Dodgers have already won the NL West title so we won't have anything like that again, but it is Vin Scully's last game to be called. EVER.
</p>
I remember watching Dodgers games on KTLA with my grandmother in the 80's. I thought baseball was slow and boring, but the way that Vin would tell stories was able to keep me interested.
</p>
Vin is able to call a game, with no emotion, just tell the story of the game. Dropping tidbits about this player or that player. Always knowing more about the people in the game while also knowing so much about the game.
</p>
He's quite literally seen everything. From perfect games to triple plays. He called Hank Aaron's historic record breaking home run. He even saw a pitcher throwing a perfect game through 7 get pulled (I'm looking at you DAve Roberts).
</p>
In the last game he ever called the Dodgers are in playoff form. This ... is not a good thing. The Dodgers are historically an awful performing playoff team, and so far, they have managed to lose 4 of their last 5 and are working on making it 5 of 6.
</p>
It's a dark and dreary day in San Francisco. It's raining in San Francisco. Kenta Maeda is pitching for the Dodgers.
</p>
Dodgers first out of the game is a Stikeout of Hunter Pence ... but the Dodgers are down 0-2. Might be a long one today
</p>
...
</p>
The game ended not with a win, but a whimper as the Dodgers lost to the Giants 7-1.
</p>
As Vin gave his last call it wasn't a great call like Charlie Culberson's Home Run to win the West (and the game) last weekend. It was a pop fly that sent the Giants back to New York to face the Mets.
</p>
Five years ago I never wanted him to retire. This season, I'm glad he decided to put the microphone up. A little slower in the outfield, not quite as quick with the bat, still the greatest broadcaster that ever lived.
</p>
Vin was teaching lessons all those years, not just calling games. It was only in his last season, his last game, that I really was able to hear them.
</p>
Realize that you are blessed to do what you do.
</p>
Don't be sad that something has ended, but be happy that it had started.
</p>
The last one gets me in a way I can't quite describe. Maybe it's where I'm at in life right now, maybe it's that it would resonate with me regardless, but it is a nice reminder, that life is what you make of it. Don't be sad that a thing has ended, but instead be happy that you had a chance to have it happen at all.
</p>
Great words Vin. Thank you
Page 7 / 7