Using justpath to go on a pyrrhic adventure to clean up my PATH
A while ago I heard about a project called justpath from Jeff Tripplet on Mastodon. It seemed like a neat project to try and clean up my path and I figured, what the heck, let me give it a try.
I installed it and when I ran it for the first time, the output looked like this
 1 /Users/ryan/.cargo/bin
 2 /usr/local/opt/ruby/bin (resolves to /usr/local/Cellar/ruby/3.2.2_1/bin)
 3 /Users/ryan/google-cloud-sdk/bin
 4 /Users/ryan/.pyenv/shims
 5 /opt/homebrew/Cellar/pyenv-virtualenv/1.2.3/shims
 6 /opt/homebrew/bin
 7 /opt/homebrew/sbin
 8 /Library/Frameworks/Python.framework/Versions/3.12/bin
 9 /usr/local/bin (duplicates: 3)
10 /usr/local/sbin
11 /Library/Frameworks/Python.framework/Versions/3.11/bin
12 /Library/Frameworks/Python.framework/Versions/3.10/bin
13 /usr/local/bin (duplicates: 3)
14 /System/Cryptexes/App/usr/bin (resolves to /System/Volumes/Preboot/Cryptexes/App/usr/bin)
15 /usr/bin
16 /bin
17 /usr/sbin
18 /sbin
19 /var/run/com.apple.security.cryptexd/codex.system/bootstrap/usr/local/bin (resolves to /private/var/run/com.apple.security.cryptexd/codex.system/bootstrap/usr/local/bin, directory does not exist)
20 /var/run/com.apple.security.cryptexd/codex.system/bootstrap/usr/bin (resolves to /private/var/run/com.apple.security.cryptexd/codex.system/bootstrap/usr/bin, directory does not exist)
21 /var/run/com.apple.security.cryptexd/codex.system/bootstrap/usr/appleinternal/bin (resolves to /private/var/run/com.apple.security.cryptexd/codex.system/bootstrap/usr/appleinternal/bin, directory does not exist)
22 /opt/X11/bin
23 /Library/Apple/usr/bin
24 /Library/TeX/texbin (resolves to /usr/local/texlive/2024basic/bin/universal-darwin)
25 /usr/local/share/dotnet
26 ~/.dotnet/tools (directory does not exist)
27 /Library/Frameworks/Mono.framework/Versions/Current/Commands (resolves to /Library/Frameworks/Mono.framework/Versions/6.12.0/Commands)
28 /Applications/Postgres.app/Contents/Versions/latest/bin (resolves to /Applications/Postgres.app/Contents/Versions/14/bin)
29 /Applications/Xamarin Workbooks.app/Contents/SharedSupport/path-bin (directory does not exist)
30 /Users/ryan/.local/bin (duplicates: 2)
31 /usr/local/bin (duplicates: 3)
32 /Users/ryan/.local/bin (duplicates: 2)
That's a lot to look at, but helpfully there are a few flags to get only the 'bad' items
justpath --invalid

justpath --duplicates
Running justpath --invalid got this
18 /var/run/com.apple.security.cryptexd/codex.system/bootstrap/ usr/local/bin (resolves to /private/var/run/com.apple.security.cryptexd/codex.system/bootstrap/usr/local/bin, directory does not exist)
19 /var/run/com.apple.security.cryptexd/codex.system/bootstrap/usr/bin (resolves to /private/var/run/com.apple.security.cryptexd/codex.system/bootstrap/usr/bin, directory does not exist)
20 /var/run/com.apple.security.cryptexd/codex.system/bootstrap/usr/appleinternal/bin (resolves to /private/var/run/com.apple.security.cryptexd/codex.system/bootstrap/usr/appleinternal/bin, directory does not exist)
26 ~/.dotnet/tools (directory does not exist)
29 /Applications/Xamarin Workbooks.app/Contents/SharedSupport/path-bin (directory does not exist)
and running justpath --duplicates got this
 8 /usr/local/bin (duplicates: 3)
12 /usr/local/bin (duplicates: 3)
30 /Users/ryan/.local/bin (duplicates: 2)
31 /usr/local/bin (duplicates: 3)
32 /Users/ryan/.local/bin (duplicates: 2)
Great! Now I know what is invalid and what is duplicated. Surely justpath will have a command to clean this up, right?
Turns out not so much, and for good reasons:
justpathdoes not alter the path itself, it provides the corrected version that a user can apply further. A child process the one that Python is running in cannot alter the parent environment PATH. As for reading the PATH -justpathrelies on what is available fromos.environ['PATH'].
So I posted on Mastodon to see how others may have approached this and Jeff replied back
I ran the tool and copied the output before starting from an empty PATH.
Then I ran justpath and added them back one at a time.
mise helped me cut at least half a dozen weird/duplicate path statements alone. I had quite a bit of tool overlap.
I poked around with trying to find where the invalid values were coming from and found this answer
Cryptexes are used to update parts of macOS quickly, without requiring a full rebuild of the SSV (see this answer for details). I don't know whether removing these paths will break the installation of such cryptexes. But if you want to take the risk, you can remove
/etc/paths.d/10-cryptex(or move it to a safe place in case you need it later on). PS: Invalid entries in PATH don't really hurt, they primarily slow down (a very little bit) the lookup of new commands run from the shell the first time.
This supported my assumption that the invalid PATH variables were likely due to macOS upgrades (I guessed that based on the existence of invalid PATH variables on other Macs in my house that didn't have a programmer / developer using them)
So, with that I found 2 files that were in /etc/paths.d and moved them to my desktop. Once that was done I restarted my terminal and got this output
 1 /Users/ryan/.cargo/bin
 2 /usr/local/opt/ruby/bin (resolves to /usr/local/Cellar/ruby/3.2.2_1/bin)
 3 /Users/ryan/google-cloud-sdk/bin
 4 /Users/ryan/.pyenv/shims
 5 /opt/homebrew/Cellar/pyenv-virtualenv/1.2.3/shims
 6 /opt/homebrew/bin
 7 /opt/homebrew/sbin
 8 /Library/Frameworks/Python.framework/Versions/3.12/bin
 9 /usr/local/bin (duplicates: 3)
10 /usr/local/sbin
11 /Library/Frameworks/Python.framework/Versions/3.11/bin
12 /Library/Frameworks/Python.framework/Versions/3.10/bin
13 /usr/local/bin (duplicates: 3)
14 /System/Cryptexes/App/usr/bin (resolves to /System/Volumes/Preboot/Cryptexes/App/usr/bin)
15 /usr/bin
16 /bin
17 /usr/sbin
18 /sbin
19 /opt/X11/bin
20 /Library/Apple/usr/bin
21 /Library/TeX/texbin (resolves to /usr/local/texlive/2024basic/bin/universal-darwin)
22 /usr/local/share/dotnet
23 /Library/Frameworks/Mono.framework/Versions/Current/Commands (resolves to /Library/Frameworks/Mono.framework/Versions/6.12.0/Commands)
24 /Applications/Postgres.app/Contents/Versions/latest/bin (resolves to /Applications/Postgres.app/Contents/Versions/14/bin)
25 /Users/ryan/.local/bin (duplicates: 2)
26 /usr/local/bin (duplicates: 3)
27 /Users/ryan/.local/bin (duplicates: 2)
This just left the duplicates that were being added. There are a few spots where applications (or people!) will add items to PATH and there are MANY opinions on which one is The Right Way TM. I use zshell and looked in each of these files (~/.profile, ~/.zshrc, ~/.zprofile) and found that only my .zshrc file contained the addition to PATH for the duplicates I was seeing
/usr/local/bin/Users/ryan/.local/bin
With that, I simply commented them out of my .zshrc, restarted my terminal and now I am down to only two duplicates duplicate
 8 /usr/local/bin (duplicates: 2)
12 /usr/local/bin (duplicates: 2)
I looked everywhere trying to find where this duplicate was coming from. I tried a few variations of find
find . -type f -name '.*' 2>/dev/null -exec grep -H '/usr/local/bin' {} \;
But the results were only the commented out lines from .zshrc.
I did find this issue on the Homebrew repo and thought I might be onto something, but it was for a different path so that doesn't seem to be the culprit.
I eventually gave up on trying to find the one true source of the duplicate entry (though I suspect that there is something adding it in the same way that Homebrew is can add a duplicate PATH variable) because I found this command
typeset -U path
I added it to my .zshrc, restarted my terminal and voila, a clean PATH
 1 /Users/ryan/.cargo/bin
 2 /Users/ryan/google-cloud-sdk/bin
 3 /Users/ryan/.pyenv/shims
 4 /opt/homebrew/Cellar/pyenv-virtualenv/1.2.3/shims
 5 /opt/homebrew/bin
 6 /opt/homebrew/sbin
 7 /Library/Frameworks/Python.framework/Versions/3.12/bin
 8 /usr/local/bin
 9 /usr/local/sbin
10 /Library/Frameworks/Python.framework/Versions/3.11/bin
11 /Library/Frameworks/Python.framework/Versions/3.10/bin
12 /System/Cryptexes/App/usr/bin (resolves to /System/Volumes/Preboot/Cryptexes/App/usr/bin)
13 /usr/bin
14 /bin
15 /usr/sbin
16 /sbin
17 /opt/X11/bin
18 /Library/Apple/usr/bin
19 /Library/TeX/texbin (resolves to /usr/local/texlive/2024basic/bin/universal-darwin)
20 /usr/local/share/dotnet
21 /Library/Frameworks/Mono.framework/Versions/Current/Commands (resolves to /Library/Frameworks/Mono.framework/Versions/6.12.0/Commands)
22 /Applications/Postgres.app/Contents/Versions/latest/bin (resolves to /Applications/Postgres.app/Contents/Versions/16/
I still want to try and figure out where that extra /usr/local/bin is coming from, but for now, I have been able to clean up my PATH.
So, the question is, does this really matter? In the answer I found the last statement really caught my attention
PS: Invalid entries in PATH don't really hurt, they primarily slow down (a very little bit) the lookup of new commands run from the shell the first time.
So the answer is, probably not, BUT just knowing that I had duplicates and invalid entries in my PATH was like a splinter in my brain 1 that needed to be excised.
What are your experiences with your PATH? Have you gone to these lengths to clean it up, figured, "Meh, it's not hurting anything, why bother?"
- Yes, that is a Matrix reference ↩︎
Trying out pyenv ... again
I think I first tried pyenv probably sometime in late 2022. I saw some recent stuff about it on Mastadon and thought I'd give it another go.
I read through the installation instructions at the ReadMe at the repo and checked to see if it was already installed (spoiler alert it was!)
I noticed that I was not on the current version (2.3.36 at the time of this writing) and decided that I needed to update it.
With the update out of the way I tried to install a version of Python with it, starting at Python 3.10 (because why not?!)
pyenv install 3.10
But when I ran it I got an error like this:
BUILD FAILED (OS X 12.3.1 using python-build 20180424)
Which lead me here. There were some comments people left about deleting directories (which always makes me a bit uneasy ... especially when they're in /Library/)
Reading further down I did come across this comment
I had to uninstall and reinstall Home Brew before it returned to work. It concerned the change from Mac Intel to Mac M1(Silicon). See the article below from Josh Alletto to find out why. https://earthly.dev/blog/homebrew-on-m1/#:~: text=On%20Intel%20Macs %2C%20Homebrew%2C%20and, %2Fusr%2Flocal%2Fbin%20.&text= Homebrew%20chose%20%2Fusr %2Flocal%2F,in%20your %20PATH%20by%20default.
The link in the comment was a bit malformed, but I was able to clean it up and get this link. This is where I re-discovered1 that the way Homebrew is installed changed with the transition to the Apple Silicon.
Now, I got a new M2 MacBook Pro in March 2023 and since I don't use Homebrew a lot AND I didn't really use pyenv for anything, I hadn't noticed that stuff kind of changed.
Following the steps outlined I was able to redo my Homebrew and now have pyenv working. Now, the only question is will it's use 'stick' with me this time?
- earlier in the day I was working through a post by Marijke about Caddy and there was a statement in her write up about how Homebrew on the M1 Macs stored files in a different directory, but when I ran the command to check where Homebrew was pointing I got the Intel location, not the Apple Silicon location ... this really should have been my first clue that some part of my set up was incorrect ↩︎
So you want to give a talk at a conference?
Last October I gave my first honest to goodness, on my own, up on the stage by myself talk at a tech conference. It was the most stressful yet fulfilling professional experience I've had.
Fulfilling in that I've wanted to get better at speaking in public and this helped in that goal.
Stressful in that I really wanted to do a good job and wasn't sure that I could, or worse, that anyone would care about what I had to say.
Well, neither of those things turned out to be true. I did get a lot of good feedback which tells me I did a good job, and people were very encouraging for the words that I had to say, so people did care.
My presentation went so well that I was even interviewed by Jay Miller.
You can see my actual talk here, but I thought it would also be interesting for you to see how I got here.
Submitting the idea
I submitted my talk idea for DCUS 2023 in May and it was selected in June. That gave me roughly 3 months to get my loose outline of an idea into a 45 minute talk.
Brain storming how the talk would go
I have tried to get a better workflow for brainstorming ideas in general, but I really wanted to up my game for this talk. To that end I used the Story Teller Tactics cards to help determine the path of the story I would tell in my presentation.
That helped when I got to mind mapping1 my talk.
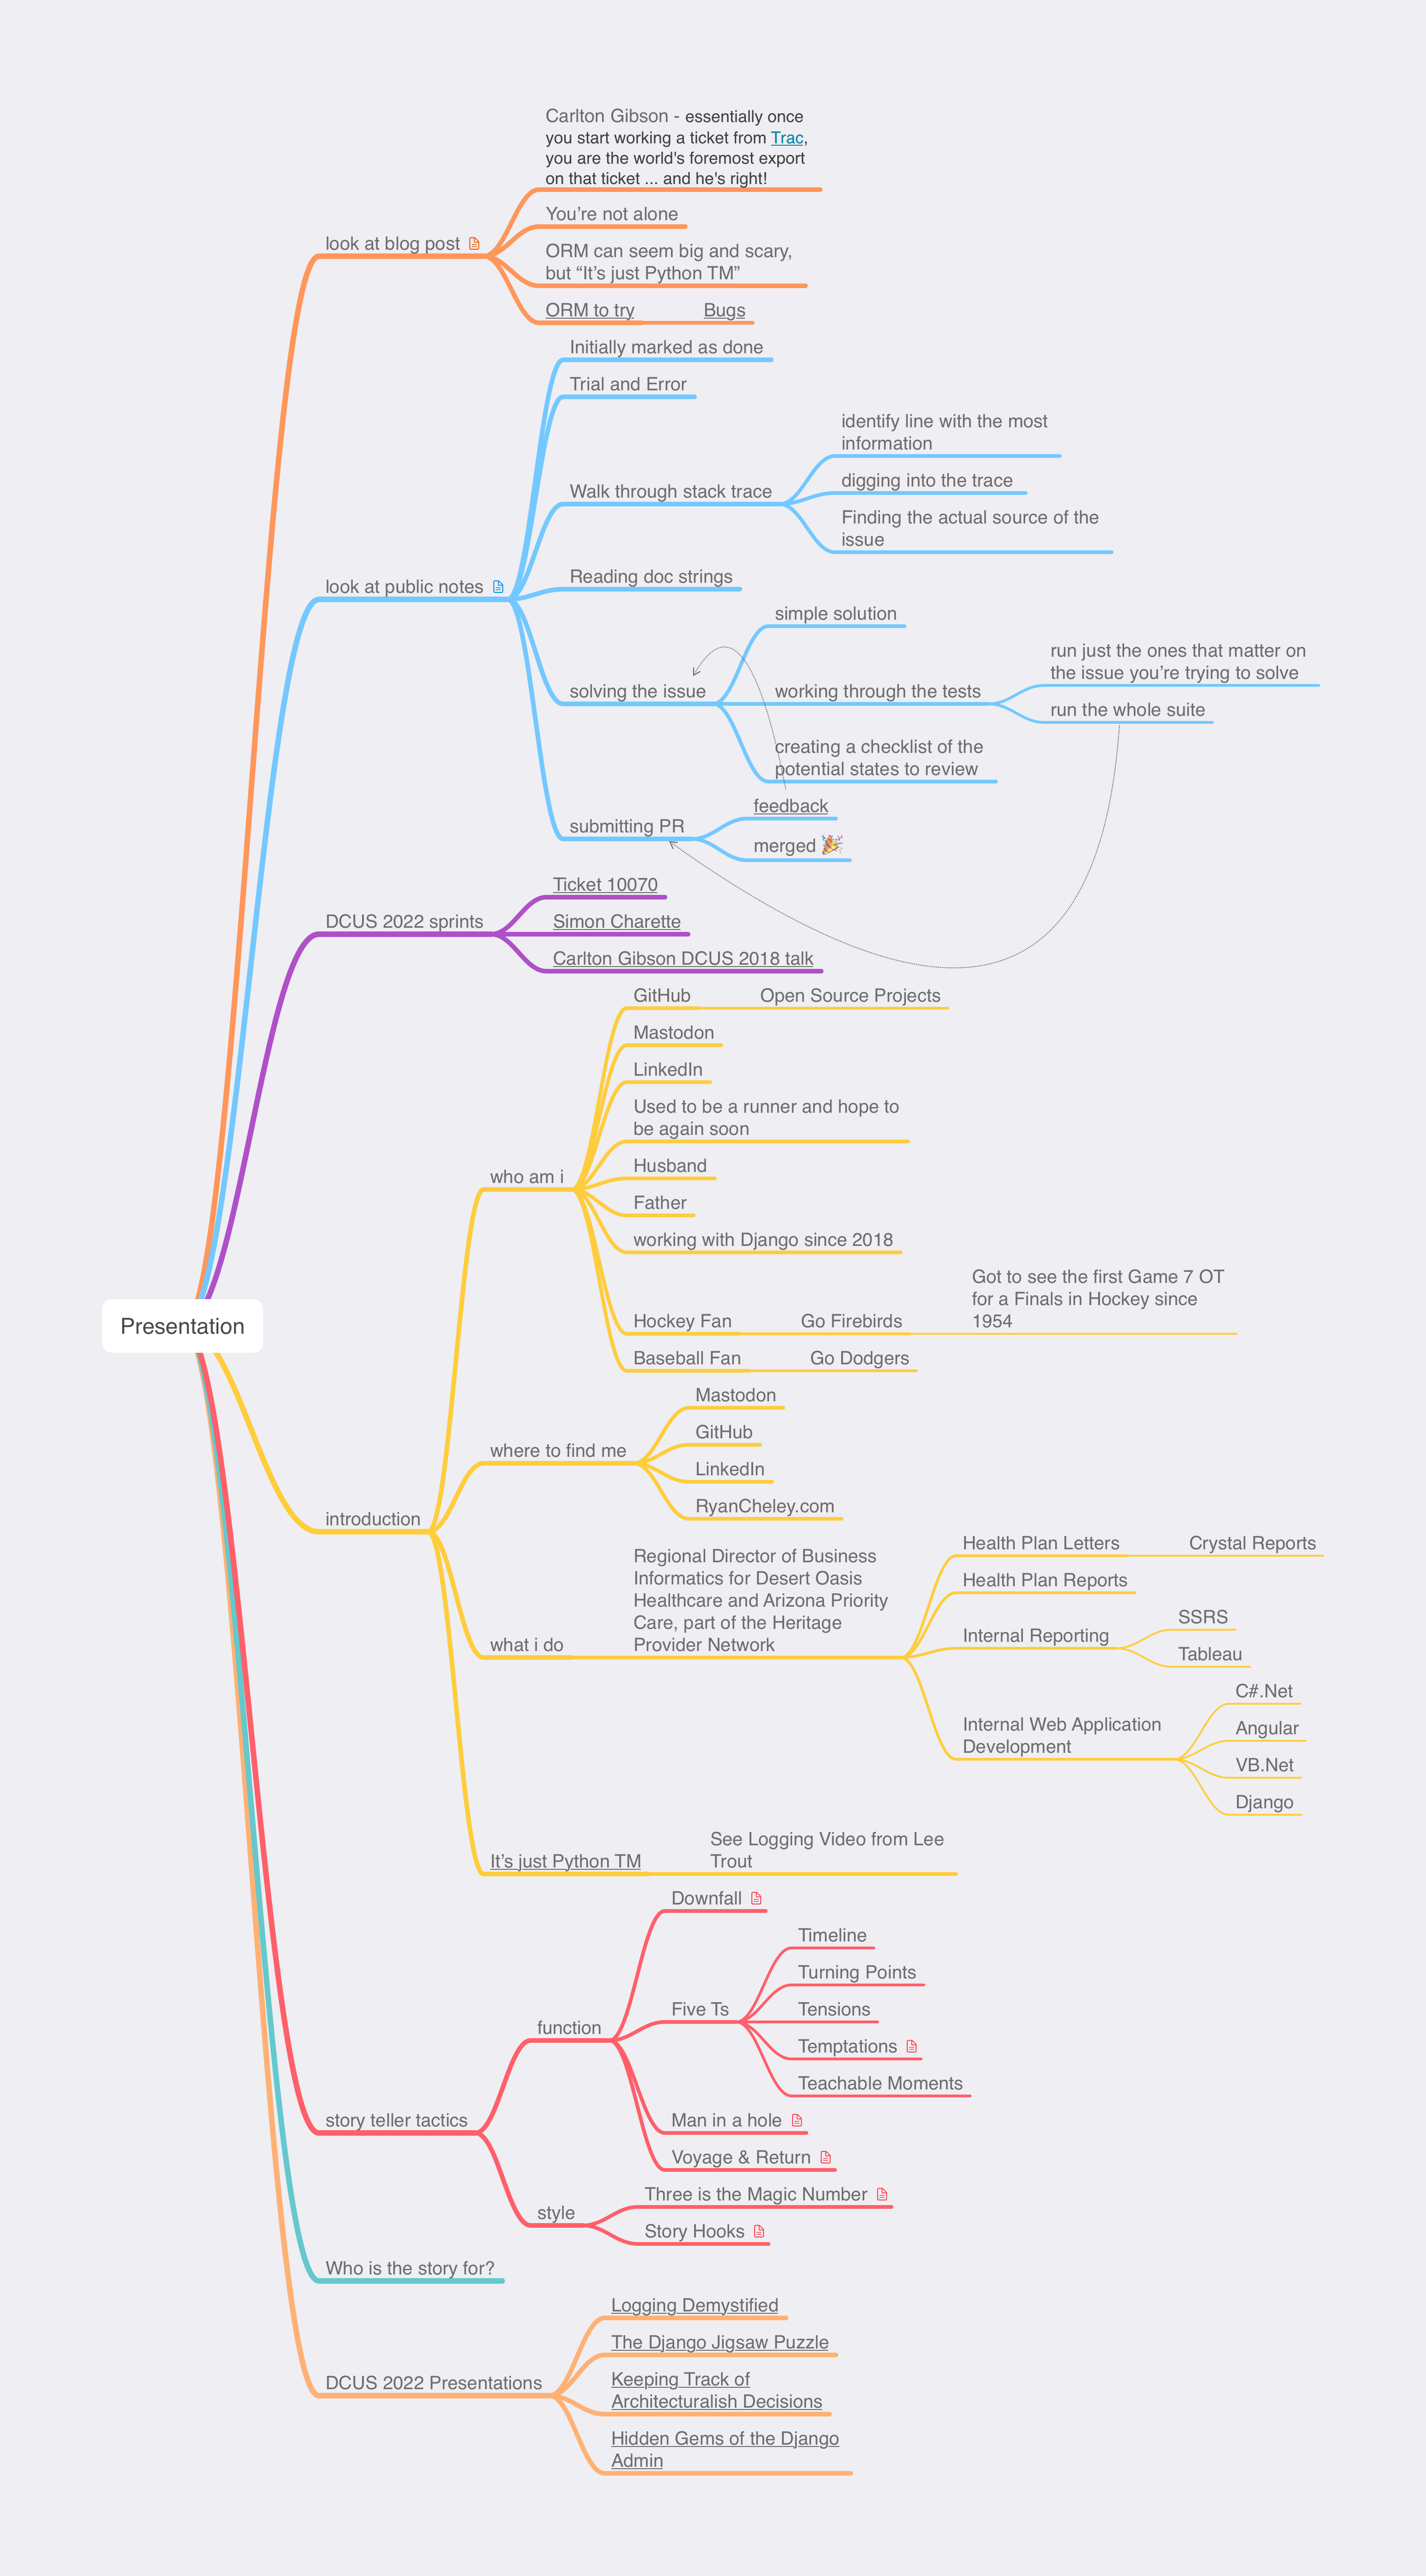
The use of the Story Teller Tactics, combined with my mind map, lead to a starting point for creating my presentation
My 'Oh Sh%t moment'
Back in early July I was browsing Mastodon (instead of working on my presentation) and came across a link to an article with the title How To Become A Better Speaker At Conferences. I saved it to my read it later service and went on browsing. A few weeks later I actually read the article (around July 25).
This bit of advice got me a little worried:
On a practical level, a 45-minute talk can take a surprisingly long time to put together. I reckon it takes me at least an hour of preparation for every minute of content.
Yikes! That means I would need to prepare and rehearse and prepare for 45 hours over the course of 14 weeks (almost 4 hours per week on average). So I set up a schedule for how I would meet this requirement
Working on the presentation
I spent all of August and the early part of September working on my presentation for about 3 hours a week. Adding slight tweaks to it here and there. I conducted a dry run with my team at work to assess my presentation's progress.
The dry run went fine, but it was clear that my presentation was missing something.
Asking for feedback
Django Con offers up mentors to help you work on your talk. If you're newer to giving presentations, I highly recommend engaging with one of them. The feedback they provide is priceless!
I had the great fortune to reach out to Katie McLaughlin who had just given a talk at PyCon Australia titled Present Like a Pro. I watched that before reaching out to her and she gave some very good advice on presentation.
Getting serious about preparing for the talk
As I said, I had done a dry run with my team at work and it was fine but I could tell that the way I was working on my presentation wasn't getting it to where I wanted it to be. So I decided to go all in on practicing and trying to make it the best I could. In order to accomplish that I believe I would need to engage in deliberate practice by actually giving my presentation. This was a breakthrough moment for me in improving the presentation and my deliver of it.
In order to have deliberate practice I set up the following routine:
- Give my presentation and RECORD it
- Watch my presentation and make notes about what needed to be improved
- Update my presentation based on the notes from #2
- Go back to step 1
Steps 1 - 3 were done on different days. For example, on Monday I would record me giving the presentation; on Tuesday I would watch the presentation and make notes; on Wednesday I would update the presentation based on my notes from Tuesday; on Thursday I would start over.
I did this a total of 7 times over 21 days. Two of these times when giving the presentation I gave it to a 'live' audience and was able to get feedback from them on various parts of the presentation.
I did one final dry run on October 13th (the Friday before my presentation was to happen for real)
That Friday was the last time I even looked at my presentation before giving it. I know some people will talk about making updates on the plane ride to the conference, or the night before, or the hour before, but that would stress the crap out of me, and I was already stressed out enough!
Giving my talk for Real
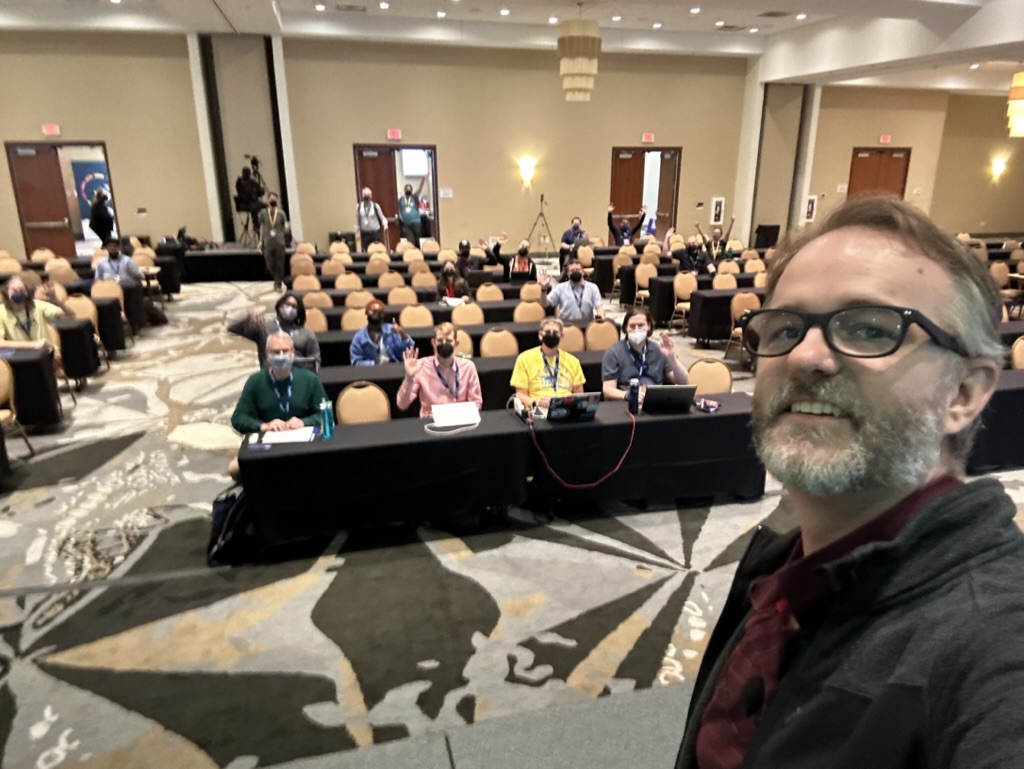
On Monday October 16th I gave my talk in front of people, in real life, for the first time. Here I am up on stage with the crowd in the background
All in all it was a really fulfilling experience, but it was pretty hard too. This was the first time I spoke at a Tech Conference and I really wanted to do well.
As I said before, I received some really good feedback on the talk and I was really glad to have done it.
Now, you might ask, "Would I have to go to all of this trouble to prepare for a talk?"
Maybe, maybe not. I just happened to find this particular prep process worked well for my brain.
It was nice to hear from some of the attendees surprised that my talk was the first honest to goodness talk on my own I had ever given because it sounded so polished and well done.
Practice makes better, and in this case (based on the videos) it sure did for me
A Big Thank you
A presentation like this took a lot out of me, but I am extremely grateful to a few people in particular:
- Katie McLaughlin
- The Team of Web Developers at work
- Bookie
- Chris
- Jason
- Jon
- My daughter Abigail
A little bit extra
If you want to see more details on my talk, here is a playlist of the dry run attempts I did to prepare2
If you want to see the repo where the changes were tracked for my presentation it can be found here
If you want to see my annotated slides, you can find them here
Time tracking
I time track the crap out of my work day, and I really wish I would have done that here just to get a more exact idea of how much time I spent preparing, but some basic back of the envelope math gives me nearly 56 hours of prep for this. One thing I do religiously for work is track my time. I do this for a couple of reasons, but for some reason, I didn't do that as I prepared for my talk here. The time I have here is mostly estimates based on my memory (which could be wildly over stated, or understated).
| Activity | Time Spent |
|---|---|
| Story Teller Tactics Work | 1.5 Hours |
| Mind Mapping Talk | 3 hours |
| Initial Draft of Presentation | 5 Hours |
| Presentation Updates | 18 Hours |
| Deliberate Practice | 28 Hours |
| Total Time | 55.5 hours |
DjangoCon US 2023
My Experience at DjangoCon US 2023
A few days ago I returned from DjangoCon US 2023 and wow, what an amazing time. The only regret I have is that I didn't take very many pictures. This is something I will need to work on for next year.
On Monday October 16th I gave a talk Contributing to Django or how I learned to stop worrying and just try to fix an ORM Bug. The video will be posted on YouTube in a few weeks. This was the first tech conference I've ever spoken at!!!! I was super nervous leading up to the talk, and even a bit at the start, but once I got going I finally settled in.
Here's me on stage taking a selfie with the crowd behind me
Luckily, my talk was one of the first non-Keynote talks so I was able to relax and enjoy the conference while the rest of the time.
After the conference talks ended on Wednesday I stuck around for the sprints. This is such a great time to be able to work on open source projects (Django adjacent or not) and just generally hang out with other Djangonauts. I was able to do some work on DjangoPackages with Jeff Triplett, and just generally hang out with some truly amazing people.
The Django community is just so great. I've been to many conferences before, but this one is the first where I feel like I belong.
I am having some of those post conference blues, but thankfully Kojo Idrissa wrote something about how to help with that. And taking his advice, it has been helpful to come down from the Conference high.
Although the location of DjangoCon US 2024 hasn't been announced yet, I'm making plans to attend.
I am also setting myself some goals to have completed by the start of DCUS 2024
- join the fundraising working group
- work on at least 1 code related ticket in Trac
- work on at least 1 doc related ticket in Trac
- have been part of a writing group with fellow Djangonauts and posted at least 1 article per month
I had a great experience speaking, and I think I'd like to do it again, but I'm still working through that.
It's a lot harder to give a talk than I thought it would be! That being said, I do have in my 'To Do' app a task to 'Brainstorm DjangoCon talk ideas' so we'll see if (1) I'm able to come up with anything, and (2) I have a talk accepted for 2024.
GCP Cloud Architect Exam Experience
Last October it was announced that Desert Oasis Healthcare (the company I work for) signed on to pilot Google's Care Studio. DOHC is the first ambulatory clinic to sign on.
I had been in some of the discovery meetings before the announcement and was really excited about the opportunity. So far our use of any Cloud platforms at work has been extremely limited (that is to say, we don't use ANY of the big three cloud solutions for our tech) so this seemed to provide a really good opportunity.
As we worked through the project scoping there were conversations about the handoff to DOHC and it occurred to me that I didn't have any knowledge of what GCP offered, what any of it did, or how any of it could work.
I've had on my 'To Do' list to learn one of the Big Three Cloud services (AWS, Azure, or GCP) but because we didn't use ANY of them at work I was (a) worried about picking the 'wrong' one and (b) worried that even if I picked one I'd NEVER be able to use it!
The partnership with Google changed that. Suddenly which cloud service to learn was apparent AND I'd be able to use whatever I learned for work!
Great, now I know which cloud service to start to learn about ... the next question is, "What do I try to learn?". In speaking with some of the folks at Google they recommended one of three Certification options:
After reviewing each of them and having a good idea of what I need to know for work, I opted for the Cloud Architect path.
Knowing which certification I was going to work towards, I started to see what learning options were available for me. It just so happens that Coursera partnered with the California State Library to offer free training which is great because Coursera has a learning path for the Cloud Architect Exam! So I signed up for the first course of that path right before Thanksgiving and started to work my way through the courses.
I spent most of the holidays working through these courses, going pretty fast through them. The labs offered up are so helpful. They actually allow you to work with GCP for FREE during your labs which is amazing.
After I made my way through the Coursera learning Path I bought the book Google Cloud Certified Professional Cloud Architect Study Guide which was really helpful. It came with 100 electronic flash cards and 2 practice exams, and each chapter had questions at the end.
I will say that the practice exams and chapter questions from the book weren't really like the ACTUAL exam questions BUT it did help me in my learning, especially regarding the case studies used in the exams.
I read through the book several times, and used the practice questions in the chapters to drive what parts of the documentation I'd read to shore up my understand of the topics.
Finally, after about 3 months of pretty constant studying I took the test. I opted for the remote proctoring option and I'd say that I really liked this option. I was able to take the test in the same place I had done most of my studying. I did have to remove essentially EVERYTHING from my home office, but not having to drive anywhere, and not having to worry about unfamiliar surroundings really helped me out (I think).
I had 2 hours in which to answer 60 questions. My general strategy for taking tests is to go through the test, mark questions that I'm unsure of and eliminate answers that I know to not be true on those questions. Once I've gone through the test I revisit all of the unsure questions and work through those.
My final pass is to go through ALL of the questions and make sure I didn't do something silly.
Using this strategy I used 1 hour and 50 minutes of the 2 hours ... and I passed!
The unfortunate part of the test is that you only get a Pass or Fail so you don't have any opportunity to know what parts of the exam you missed. Now, if you fail this could be a huge help in working to pass it next time, but even if you pass it I think it would be helpful to know what areas you might struggle in.
All in all this was a pretty great experience and it's already helping with the GCP implementation at work. I'm able to ask better questions because I'm at least aware of the various services and what they do.
Contributing to Django or how I learned to stop worrying and just try to fix an ORM Bug
I went to DjangoCon US a few weeks ago and hung around for the sprints. I was particularly interested in working on open tickets related to the ORM. It so happened that Simon Charette was at Django Con and was able to meet with several of us to talk through the inner working of the ORM.
With Simon helping to guide us, I took a stab at an open ticket and settled on 10070. After reviewing it on my own, and then with Simon, it looked like it wasn't really a bug anymore, and so we agreed that I could mark it as done.
Kind of anticlimactic given what I was hoping to achieve, but a closed ticket is a closed ticket! And so I tweeted out my accomplishment for all the world to see.
A few weeks later though, a comment was added that it actually was still a bug and it was reopened.
I was disappointed ... but I now had a chance to actually fix a real bug! I started in earnest.
A suggestion / pattern for working through learning new things that Simon Willison had mentioned was having a public-notes repo on GitHub. He's had some great stuff that he's worked through that you can see here.
Using this as a starting point, I decided to walk through what I learned while working on this open ticket.
Over the course of 10 days I had a 38 comment 'conversation with myself' and it was super helpful!
A couple of key takeaways from working on this issue:
- Carlton Gibson said essentially once you start working a ticket from Trac, you are the world's foremost export on that ticket ... and he's right!
- ... But, you're not working the ticket alone! During the course of my work on the issue I had help from Simon Charette, Mariusz Felisiak, Nick Pope, and Shai Berger
- The ORM can seem big and scary ... but remember, it's just Python
I think that each of these lesson learned is important for anyone thinking of contributing to Django (or other open source projects).
That being said, the last point is one that I think can't be emphasized enough.
The ORM has a reputation for being this big black box that only 'really smart people' can understand and contribute to. But, it really is just Python.
If you're using Django, you know (more likely than not) a little bit of Python. Also, if you're using Django, and have written any models, you have a conceptual understanding of what SQL is trying to do (well enough I would argue) that you can get in there AND make sense of what is happening.
And if you know a little bit of Python a great way to learn more is to get into a project like Django and try to fix a bug.
My initial solution isn't the final one that got merged ... it was a collaboration with 4 people, 2 of whom I've never met in real life, and the other 2 I only just met at DjangoCon US a few weeks before.
While working through this I learned just as much from the feedback on my code as I did from trying to solve the problem with my own code.
All of this is to say, contributing to open source can be hard, it can be scary, but honestly, I can't think of a better place to start than Django, and there are lots of places to start.
And for those of you feeling a bit adventurous, there are plenty of ORM tickets just waiting for you to try and fix them!
Upgrading to PostgreSQL 14
Django 4.1 was released on August 3, 2022 and I was excited to upgrade to it. I did the testing locally and then pushed my changes up to GitHub to deploy. The deployment was successful, but when I went to visit my sites ... womp womp. I got a Server Error 5XX.
What happened? Well, it turns out that Django 4.1 dropped support for Postgres 10 and that just so happens to be the version I was running on my production server (but not on my local dev machine ... I was running Postgres 14).
OK, so I am going to need to upgrade in order to get the features of anything above Django 4.0 ... and honestly, I've needed to upgrade past Postgres 10 for a while.
I found this StackOverflow question and answer and it helped me a ton! It was to upgrade from Psotgres 10 to 12, but the ideas were the same (but replace 12 with 14). There is also a step that indicates you need to run ./analyze_new_cluster.sh but that seems to be only for version 12(maybe 13) and lower.
Everything was fine until I visited my site and got a Server Error 5XX AGAIN!
What gives?
My first assumption was that maybe the postgres server didn't start back up properly after the upgrade. I checked the service to verify that it was running, and it was
ps -aux | grep postgres
which returned
postgres   988  0.0  1.3 321668 27588 ?        Ss   16:55   0:01 /usr/lib/postgresql/14/bin/postgres -D /var/lib/postgresql/14/main -c config_file=/etc/postgresql/14/main/postgresql.conf
postgres  1034  0.0  0.2 321788  6112 ?        Ss   16:55   0:00 postgres: 14/main: checkpointer
postgres  1035  0.0  0.2 321800  5996 ?        Ss   16:55   0:00 postgres: 14/main: background writer
postgres  1036  0.0  0.4 321668  9388 ?        Ss   16:55   0:00 postgres: 14/main: walwriter
postgres  1039  0.0  0.3 322356  8080 ?        Ss   16:55   0:00 postgres: 14/main: autovacuum launcher
postgres  1040  0.0  0.2 176828  5108 ?        Ss   16:55   0:00 postgres: 14/main: stats collector
postgres  1041  0.0  0.3 322224  6628 ?        Ss   16:55   0:00 postgres: 14/main: logical replication launcher
root      4868  0.0  0.0  14860  1072 pts/0    S+   18:47   0:00 grep --color=auto postgres
I also checked
systemctl status postgresql
which returned as expected
● postgresql.service - PostgreSQL RDBMS
   Loaded: loaded (/lib/systemd/system/postgresql.service; enabled; vendor preset: enabled)
   Active: active (exited) since Sun 2022-08-28 16:55:32 UTC; 1h 54min ago
  Process: 1169 ExecStart=/bin/true (code=exited, status=0/SUCCESS)
 Main PID: 1169 (code=exited, status=0/SUCCESS)

Aug 28 16:55:32 server-name systemd[1]: Starting PostgreSQL RDBMS...
Aug 28 16:55:32 server-name systemd[1]: Started PostgreSQL RDBMS.
One last thing to try
python manage.py makemigrations
This gave me a hint as to what the issue was:
RuntimeWarning: Got an error checking a consistent migration history performed for database connection 'default': connection to server at "127.0.0.1", port 5432 failed: FATAL: password authentication failed for user "user" connection to server at "127.0.0.1", port 5432 failed: FATAL:
Hmmm ... a quick google search doesn't specifically answer it, but it helps me to get the to answer.
The 'user' isn't able to connect to the database. Maybe the upgrade process resets the password of users in the database or it just doesn't keep the users.
A quick look at the users on the database showed me that the users were still there, so the only thing left to do at this point was to set the user passwords to be what my settings are expecting.
To do that I ran
ALTER USER user WITH PASSWORD 'password';
I did this for the databases that were associated with my websites that were returning 5XX errors and voila! That fixed the issue.
I'm sure that there is a way to keep the passwords for the users after the upgrade, but I haven't been able to find it.
The next time I need to upgrade PostgreSQL I am going to refer back to this post to remind myself what I did last time 😀
Django and Legacy Databases
I work at a place that is heavily investing in the Microsoft Tech Stack. Windows Servers, c#.Net, Angular, VB.net, Windows Work Stations, Microsoft SQL Server ... etc
When not at work, I really like working with Python and Django. I've never really thought I'd be able to combine the two until I discovered the package mssql-django which was released Feb 18, 2021 in alpha and as a full-fledged version 1 in late July of that same year.
Ever since then I've been trying to figure out how to incorporate Django into my work life.
I'm going to use this series as an outline of how I'm working through the process of getting Django to be useful at work. The issues I run into, and the solutions I'm (hopefully) able to achieve.
I'm also going to use this as a more in depth analysis of an accompanying talk I'm hoping to give at Django Con 2022 later this year.
I'm going to break this down into a several part series that will roughly align with the talk I'm hoping to give. The parts will be:
- Introduction/Background
- Overview of the Project
- Wiring up the Project Models
- Database Routers
- Django Admin Customization
- Admin Documentation
- Review & Resources
My intention is to publish one part every week or so. Sometimes the posts will come fast, and other times not. This will mostly be due to how well I'm doing with writing up my findings and/or getting screenshots that will work.
The tool set I'll be using is:
- docker
- docker-compose
- Django
- MS SQL
- SQLite
Inserting a URL in Markdown in VS Code
Since I switched my blog to pelican last summer I've been using VS Code as my writing app. And it's really good for writing, note just code but prose as well.
The one problem I've had is there's no keyboard shortcut for links when writing in markdown ... at least not a default / native keyboard shortcut.
In other (macOS) writing apps you just select the text and press ⌘+k and boop! There's a markdown link set up for you. But not so much in VS Code.
I finally got to the point where that was one thing that may have been keeping me from writing because of how much 'friction' it caused!
So, I decided to figure out how to fix that.
I did have to do a bit of googling and eventually found this StackOverflow answer
Essentially the answer is
- Open the Preferences Page: ⌘+Shift+P
- Select
Preferences: Open Keyboard Shortcuts (JSON) - Update the
keybindings.jsonfile to include a new key
The new key looks like this:
{
    "key": "cmd+k",
    "command": "editor.action.insertSnippet",
    "args": {
        "snippet": "[${TM_SELECTED_TEXT}]($0)"
    },
    "when": "editorHasSelection && editorLangId == markdown "
}
Honestly, it's little things like this that can make life so much easier and more fun. Now I just need to remember to do this on my work computer 😀
Logging Part 2
In my previous post I wrote about inline logging, that is, using logging in the code without a configuration file of some kind.
In this post I'm going to go over setting up a configuration file to support the various different needs you may have for logging.
Previously I mentioned this scenario:
Perhaps the DevOps team wants robust logging messages on anything
ERRORand above, but the application team wants to haveINFOand above in a rotating file name schema, while the QA team needs to have theDEBUGand up output to standard out.
Before we get into how we may implement something like what's above, let's review the parts of the Logger which are:
Formatters
In a logging configuration file you can have multiple formatters specified. The above example doesn't state WHAT each team need, so let's define it here:
- DevOps: They need to know when the error occurred, what the level was, and what module the error came from
- Application Team: They need to know when the error occurred, the level, what module and line
- The QA Team: They need to know when the error occurred, the level, what module and line, and they need a stack trace
For the Devops Team we can define a formatter as such1:
'%(asctime)s - %(levelname)s - %(module)s'
The Application team would have a formatter like this:
'%(asctime)s - %(levelname)s - %(module)s - %(lineno)s'
while the QA team would have one like this:
'%(asctime)s - %(levelname)s - %(module)s - %(lineno)s'
Handlers
The Handler controls where the data from the log is going to be sent. There are several kinds of handlers, but based on our requirements above, we'll only be looking at three of them (see the documentation for more types of handlers)
From the example above we know that the DevOps team wants to save the output to a file, while the Application Team wants to have the log data saved in a way that allows the log files to not get too big. Finally, we know that the QA team wants the output to go directly to stdout
We can handle all of these requirements via the handlers. In this case, we'd use
- FileHandler for the DevOps team
- RotatingFileHandler for the Application team
- StreamHandler for the QA team
Configuration File
Above we defined the formatter and handler. Now we start to put them together. The basic format of a logging configuration has 3 parts (as described above). The example I use below is YAML, but a dictionary or a conf file would also work.
Below we see five keys in our YAML file:
version: 1
formatters:
handlers:
loggers:
root:
  level:
  handlers:
The version key is to allow for future versions in case any are introduced. As of this writing, there is only 1 version ... and it's version: 1
Formatters
We defined the formatters above so let's add them here and give them names that map to the teams
version: 1
formatters:
  devops:
    format: '%(asctime)s - %(levelname)s - %(module)s'
  application:
    format: '%(asctime)s - %(levelname)s - %(module)s - %(lineno)s'
  qa:
    format: '%(asctime)s - %(levelname)s - %(module)s - %(lineno)s'
Right off the bat we can see that the formatters for application and qa are the same, so we can either keep them separate to help allow for easier updates in the future (and to be more explicit) OR we can merge them into a single formatter to adhere to DRY principals.
I'm choosing to go with option 1 and keep them separate.
Handlers
Next, we add our handlers. Again, we give them names to map to the team. There are several keys for the handlers that are specific to the type of handler that is used. For each handler we set a level (which will map to the level from the specs above).
Additionally, each handler has keys associated based on the type of handler selected. For example, logging.FileHandler needs to have the filename specified, while logging.StreamHandler needs to specify where to output to.
When using logging.handlers.RotatingFileHandler we have to specify a few more items in addition to a filename so the logger knows how and when to rotate the log writing.
version: 1
formatters:
  devops:
    format: '%(asctime)s - %(levelname)s - %(module)s'
  application:
    format: '%(asctime)s - %(levelname)s - %(module)s - %(lineno)s'
  qa:
    format: '%(asctime)s - %(levelname)s - %(module)s - %(lineno)s'
handlers:
  devops:
    class: logging.FileHandler
    level: ERROR
    filename: 'devops.log'
  application:
    class: logging.handlers.RotatingFileHandler
    level: INFO
    filename: 'application.log'
    mode: 'a'
    maxBytes: 10000
    backupCount: 3
  qa:
    class: logging.StreamHandler
    level: DEBUG
    stream: ext://sys.stdout
What the setup above does for the devops handler is to output the log data to a file called devops.log, while the application handler outputs to a rotating set of files called application.log. For the application.log it will hold a maximum of 10,000 bytes. Once the file is 'full' it will create a new file called application.log.1, copy the contents of application.log and then clear out the contents of application.log to start over. It will do this 3 times, giving the application team the following files:
- application.log
- application.log.1
- application.log.2
Finally, the handler for QA will output directly to stdout.
Loggers
Now we can take all of the work we did above to create the formatters and handlers and use them in the loggers!
Below we see how the loggers are set up in configuration file. It seems a bit redundant because I've named my formatters, handlers, and loggers all matching terms, but 🤷♂️
The only new thing we see in the configuration below is the new propagate: no for each of the loggers. If there were parent loggers (we don't have any) then this would prevent the logging information from being sent 'up' the chain to parent loggers.
The documentation has a good diagram showing the workflow for how the propagate works.
Below we can see what the final, fully formed logging configuration looks like.
version: 1
formatters:
  devops:
    format: '%(asctime)s - %(levelname)s - %(module)s'
  application:
    format: '%(asctime)s - %(levelname)s - %(module)s - %(lineno)s'
  qa:
    format: '%(asctime)s - %(levelname)s - %(module)s - %(lineno)s'
handlers:
  devops:
    class: logging.FileHandler
    level: ERROR
    filename: 'devops.log'
  application:
    class: logging.handlers.RotatingFileHandler
    level: INFO
    filename: 'application.log'
    mode: 'a'
    maxBytes: 10000
    backupCount: 3
  qa:
    class: logging.StreamHandler
    level: DEBUG
    stream: ext://sys.stdout
loggers:
  devops:
    level: ERROR
    formatter: devops
    handlers: [devops]
    propagate: no
  application:
    level: INFO
    formatter: application
    handlers: [application]
    propagate: no
  qa:
    level: DEBUG
    formatter: qa
    handlers: [qa]
    propagate: no
root:
  level: ERROR
  handlers: [devops, application, qa]
In my next post I'll write about how to use the above configuration file to allow the various teams to get the log output they need.
- full documentation on what is available for the formatters can be found here: https://docs.python.org/3/library/logging.html#logrecord-attributes ↩︎
Page 2 / 13