Cronjob ... Finally
I’ve mentioned before that I have been working on getting the hummingbird video upload automated.
Each time I thought I had it, and each time I was wrong.
For some reason I could run it from the command line without issue, but when the cronjob would try and run it ... nothing.
Turns out, it was running, it just wasn’t doing anything. And that was my fault.
The file I had setup in cronjob was called run_scrip.sh
At first I was confused because the script was suppose to be writing out to a log file all of it’s activities. But it didn’t appear to.
Then I noticed that the log.txt file it was writing was in the main \` directory. That should have been my first clue.
I kept trying to get the script to run, but suddenly, in a blaze of glory, realized that it was running, it just wasn’t doing anything.
And it wasn’t doing anything for the same reason that the log file was being written to the \` directory.
All of the paths were relative instead of absolute, so when the script ran the command ./create_mp4.sh it looks for that script in the home directory, didn’t find it, and moved on.
The fix was simple enough, just add absolute paths and we’re golden.
That means my run_script.sh goes from this:
# Create the script that will be run
./create_script.sh
echo "Create Shell Script: $(date)" >> log.txt

# make the script that was just created executable
chmod +x /home/pi/Documents/python_projects/create_mp4.sh

# Create the script to create the mp4 file
/home/pi/Documents/python_projects/create_mp4.sh
echo "Create MP4 Shell Script: $(date)" >> /home/pi/Documents/python_projects/log.txt

# upload video to YouTube.com
/home/pi/Documents/python_projects/upload.sh
echo "Uploaded Video to YouTube.com: $(date)" >> /home/pi/Documents/python_projects/log.txt

# Next we remove the video files locally
rm /home/pi/Documents/python_projects/*.h264
echo "removed h264 files: $(date)" >> /home/pi/Documents/python_projects/log.txt

rm /home/pi/Documents/python_projects/*.mp4
echo "removed mp4 file: $(date)" >> /home/pi/Documents/python_projects/log.txt
To this:
# change to the directory with all of the files
cd /home/pi/Documents/python_projects/

# Create the script that will be run
/home/pi/Documents/python_projects/create_script.sh
echo "Create Shell Script: $(date)" >> /home/pi/Documents/python_projects/log.txt

# make the script that was just created executable
chmod +x /home/pi/Documents/python_projects/create_mp4.sh

# Create the script to create the mp4 file
/home/pi/Documents/python_projects/create_mp4.sh
echo "Create MP4 Shell Script: $(date)" >> /home/pi/Documents/python_projects/log.txt

# upload video to YouTube.com
/home/pi/Documents/python_projects/upload.sh
echo "Uploaded Video to YouTube.com: $(date)" >> /home/pi/Documents/python_projects/log.txt

# Next we remove the video files locally
rm /home/pi/Documents/python_projects/*.h264
echo "removed h264 files: $(date)" >> /home/pi/Documents/python_projects/log.txt

rm /home/pi/Documents/python_projects/*.mp4
echo "removed mp4 file: $(date)" >> /home/pi/Documents/python_projects/log.txt
I made this change and then started getting an error about not being able to access a json file necessary for the upload to YouTube. Sigh.
Then while searching for what directory the cronjob was running from I found this very simple idea. The response was, why not just change it to the directory you want. 🤦♂️
I added the cd to the top of the file:
# change to the directory with all of the files
cd /home/pi/Documents/python_projects/
Anyway, now it works. Finally!
Tomorrow will be the first time (unless of course something else goes wrong) that The entire process will be automated. Super pumped!
SSL ... Finally!
I’ve been futzing around with SSL on this site since last December. I’ve had about 4 attempts and it just never seemed to work.
Earlier this evening I was thinking about getting a second Linode just to get a fresh start. I was this close to getting it when I thought, what the hell, let me try to work it out one more time.
And this time it actually worked.
I’m not really sure what I did differently, but using this site seemed to make all of the difference.
The only other thing I had to do was make a change in the word press settings (from http to https) and enable a plugin Really Simple SSL and it finally worked.
I even got an ‘A’ from SSL Labs!
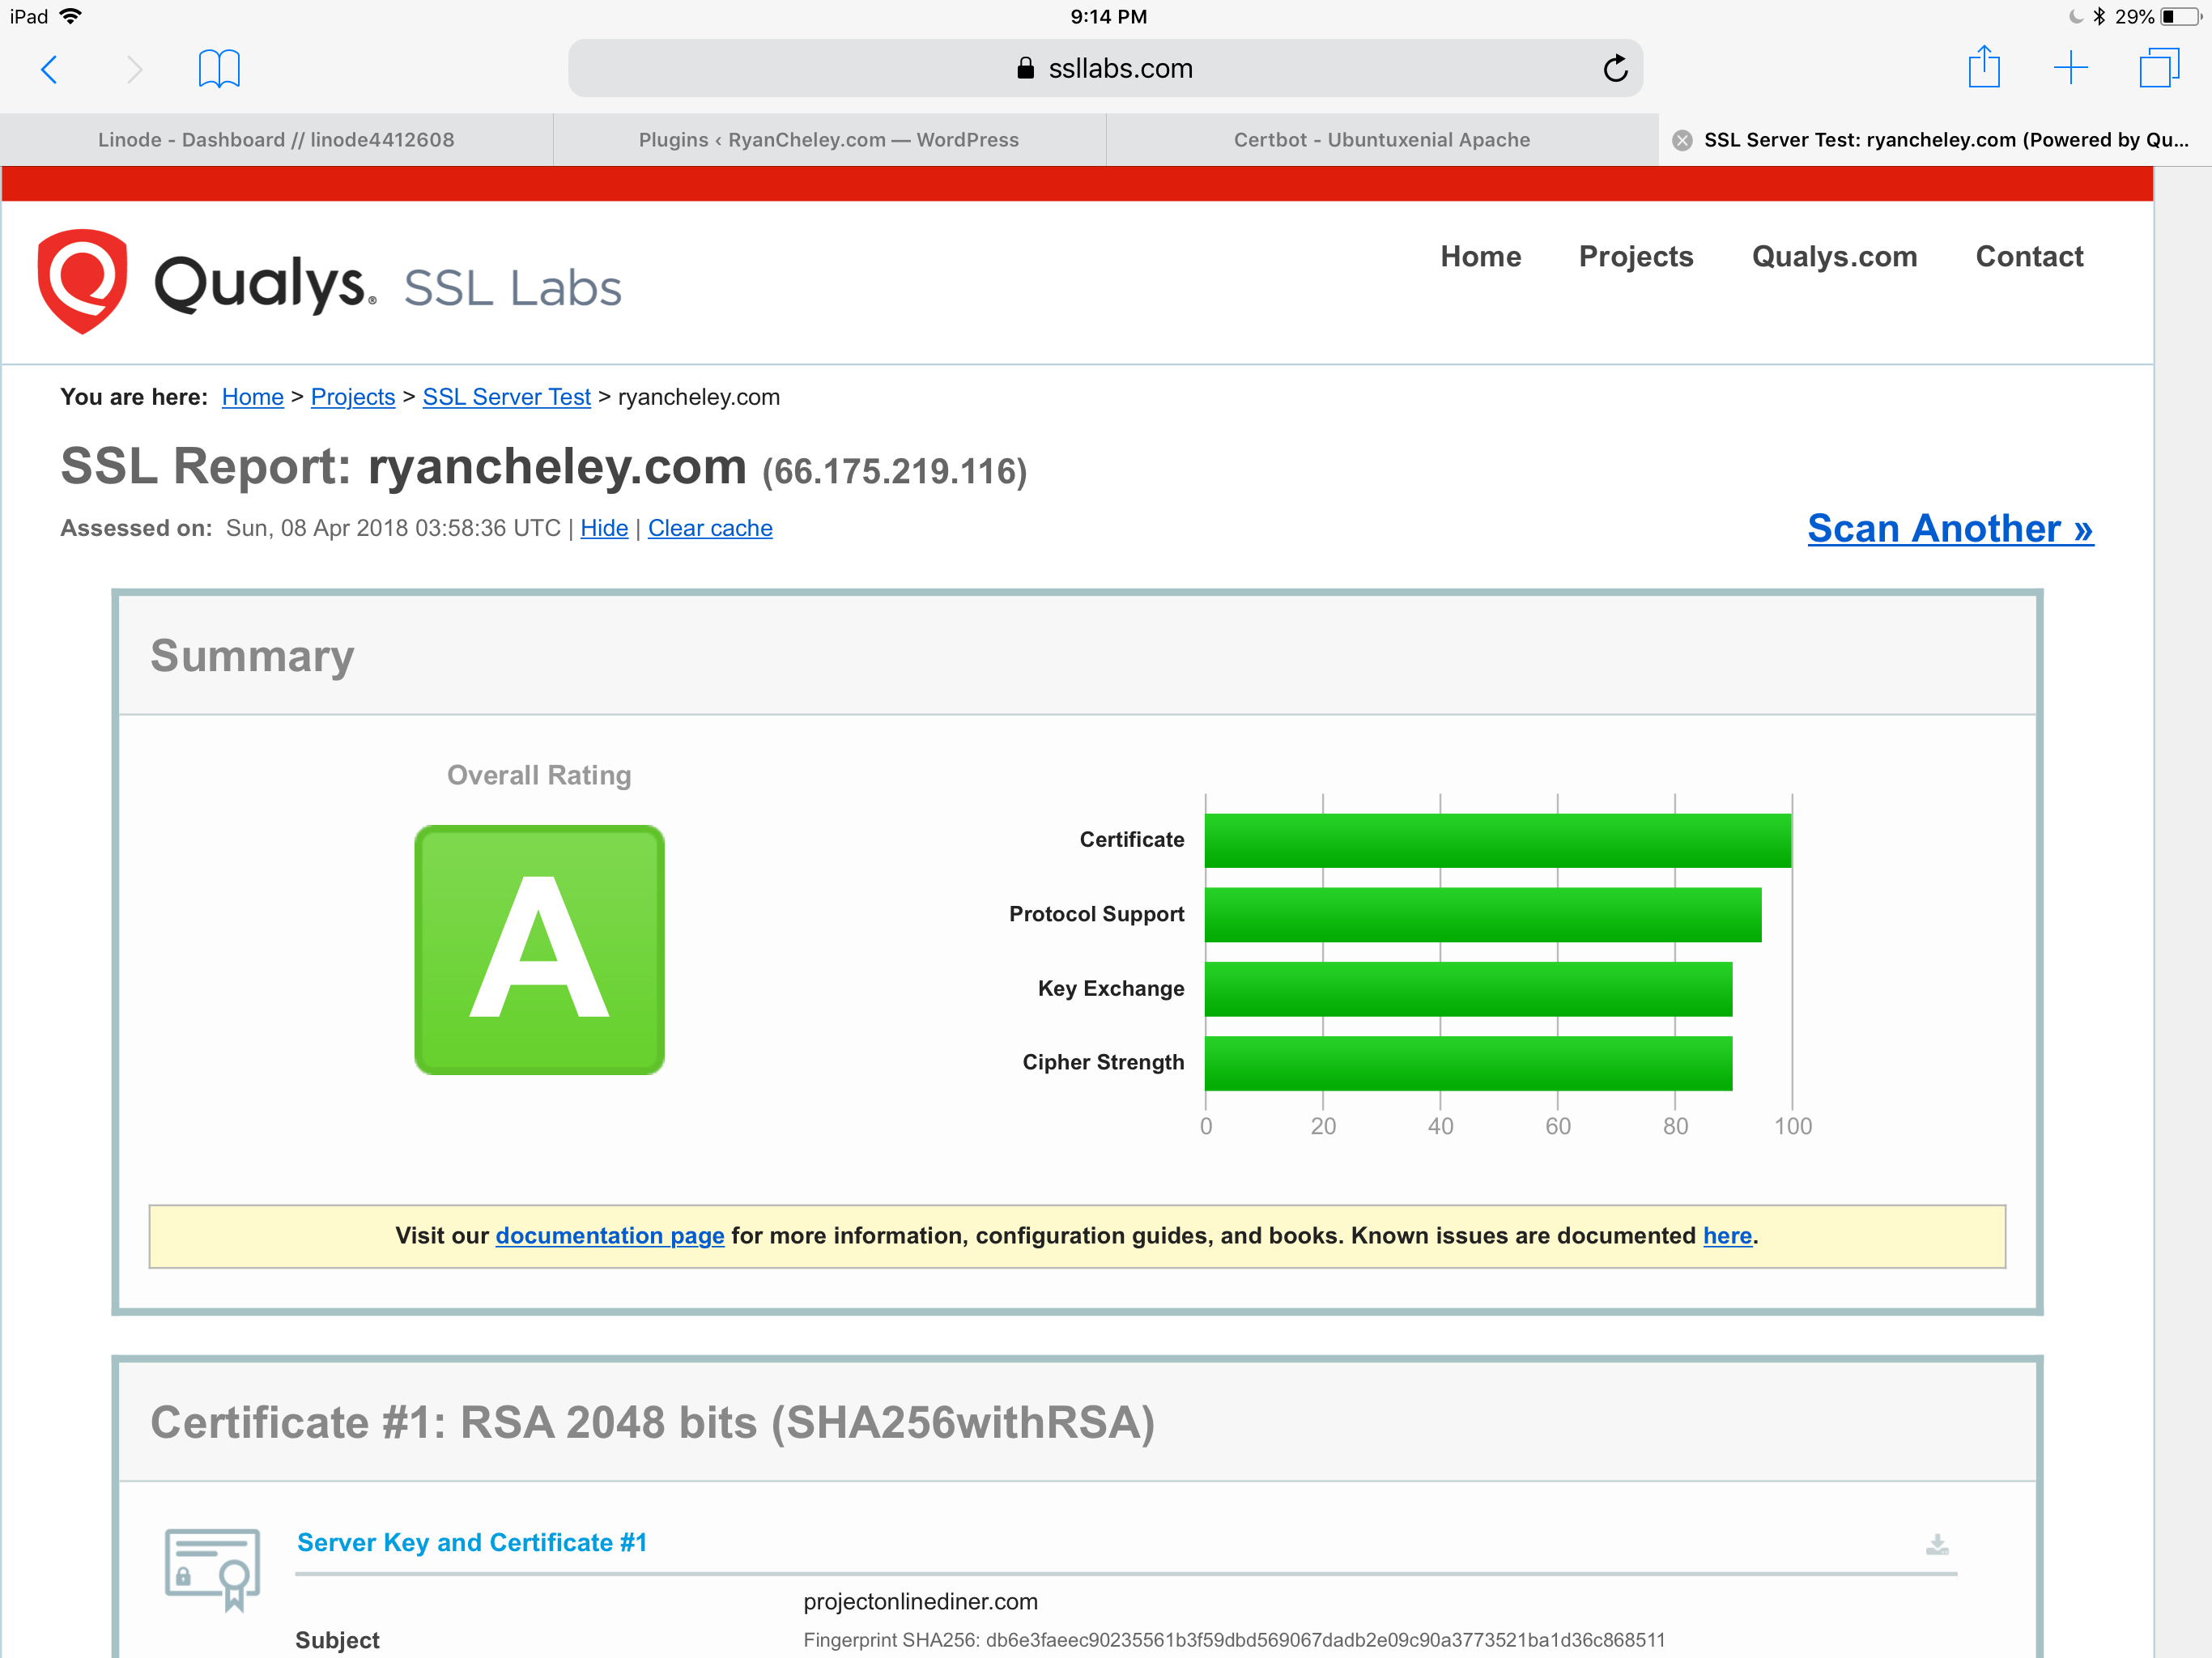
Again, not really sure why this seemed so hard and took so long.
I guess sometimes you just have to try over and over and over again
Hummingbird Video Capture
I previously wrote about how I placed my Raspberry Pi above my hummingbird feeder and added a camera to it to capture video.
Well, the day has finally come where I’ve been able to put my video of it up on YouTube! It’s totally silly, but it was satisfying getting it out there for everyone to watch and see.
Hummingbird Video Capture: Addendum
The code used to generate the the mp4 file haven’t changed (really). I did do a couple of things to make it a little easier though.
I have 2 scripts that generate the file and then copy it from the pi to my MacBook Pro and the clean up:
Script 1 is called create_script.sh and looks like this:
(echo '#!/bin/sh'; echo -n "MP4Box"; array=($(ls *.h264)); for index in ${!array[@]}; do if [ "$index" -eq 0 ]; then echo -n " -add ${array[index]}"; else echo -n " -cat ${array[index]}"; fi; done; echo -n " hummingbird.mp4") > create_mp4.sh | chmod +x create_mp4.sh
This creates a script called create_mp4.sh and makes it executable.
This script is called by another script called run_script.sh and looks like this:
./create_script.sh
./create_mp4.sh

scp hummingbird.mp4 ryan@192.168.1.209:/Users/ryan/Desktop/

# Next we remove the video files locally

rm *.h264
rm *.mp4
It runs the create_script.sh which creates create_mpr.sh and then runs it.
Then I use the scp command to copy the mp4 file that was just created over to my Mac Book Pro.
As a last bit of housekeeping I clean up the video files.
I’ve added this run_script.sh to a cron job that is scheduled to run every night at midnight.
We’ll see how well it runs tomorrow night!
How to pick a team to root for (when the Dodgers aren’t playing)
I’ve been thinking a bit about how to decide which team to root for. Mostly I just want to stay logically consistent with the way I choose to root for a team (when the Dodgers aren't playing obviously).
After much thought (and sketches on my iPad) I’ve come up with this table to help me determine who to root for:
Opp1 / Opp 2 NL West NL Central NL East AL West AL Central AL East NL West Root for team that helps the Dodgers NL Central Team NL East Team NL West Team,unless it hurts the Dodgers NL West Team,unless it hurts the Dodgers NL West Team,unless it hurts the Dodgers NL Central NL Central Team Root for underdog NL Central Team NL Central Team NL Central Team NL Central Team NL East NL East Team NL Central Team Root for underdog NL East Team NL East Team NL East Team AL West NL West Team,unless it hurts the Dodgers NL Central Team NL East Team The Angels over the A's over the Mariners over the Rangers over the Astros AL West Team AL West Team AL Central NL West Team,unless it hurts the Dodgers NL Central Team NL East Team AL West Team Root for underdog AL Central Team AL East NL West Team,unless it hurts the Dodgers NL Central Team NL East Team AL West Team AL Central Team Root for underdog (unless it's the Yankees)
The basic rule is root for the team that helps the Dodgers payoff changes, then National League over American League and finally West over Central over East (from a division perspective).
There were a couple of cool sketches I made, on real paper and my iPad. Turns out, sometimes you really need to think about thing before you write it down and commit to it.
Of course, this is all subject to change depending on the impact any game would have on the Dodgers.
ITFDB Demo
Last Wednesday if you would have asked what I had planned for Easter I would have said something like, “Going to hide some eggs for my daughter even though she knows the Easter bunny isn’t real.”
Then suddenly my wife and I were planning on entertaining for 11 family members. My how things change!
Since I was going to have family over, some of whom are Giants fans, I wanted to show them the ITFDB program I have set up with my Pi.
The only problem is that they would be over at 10am and leave by 2pm while the game doesn’t start until 5:37pm (Thanks ESPN).
To help demonstrate the script I wrote a demo script to display a message on the Pi and play the Vin Scully mp3.
The Code was simple enough:
from sense_hat import SenseHat
import os


def main():
    sense = SenseHat()
    message = '#ITFDB!!! The Dodgers will be playing San Francisco at 5:37pm tonight!'
    sense.show_message(message, scroll_speed=0.05)
    os.system("omxplayer -b /home/pi/Documents/python_projects/itfdb/dodger_baseball.mp3")


if __name__ == '__main__':
    main()
But then the question becomes, how can I easily launch the script without futzing with my laptop?
I knew that I could run a shell script for the Workflow app on my iPhone with a single action, so I wrote a simple shell script
python3 ~/Documents/python_projects/itfdb/demo.py
Which was called itfdb_demo.sh
And made it executable
chmod u+x itfdb_demo.sh
Finally, I created a WorkFlow which has only one action Run Script over SSH and added it to my home screen so that with a simple tap I could demo the results.
The WorkFlow looks like this:

Nothing too fancy, but I was able to reliably and easily demonstrate what I had done. And it was pretty freaking cool!
Daylight Savings Time
Dr Drang has posted on Daylight Savings in the past, but in a recent post he critiqued (rightly so) the data presentation by a journalist at the Washington Post on Daylight Savings, and that got me thinking.
In the post he generated a chart showing both the total number of daylight hours and the sunrise / sunset times in Chicago. However, initially he didn’t post the code on how he generated it. The next day, in a follow up post, he did and that really got my thinking.
I wonder what the chart would look like for cities up and down the west coast (say from San Diego, CA to Seattle WA)?
Drang’s post had all of the code necessary to generate the graph, but for the data munging, he indicated:
If I were going to do this sort of thing on a regular basis, I’d write a script to handle this editing, but for a one-off I just did it “by hand.”
Doing it by hand wasn’t going to work for me if I was going to do several cities and so I needed to write a parser for the source of the data (The US Naval Observatory).
The entire script is on my GitHub sunrisesunset repo. I won’t go into the nitty gritty details, but I will call out a couple of things that I discovered during the development process.
Writing a parser is hard. Like really hard. Each time I thought I had it, I didn’t. I was finally able to get the parser to work o cities with 01, 29,30, or 31 in their longitude / latitude combinations.
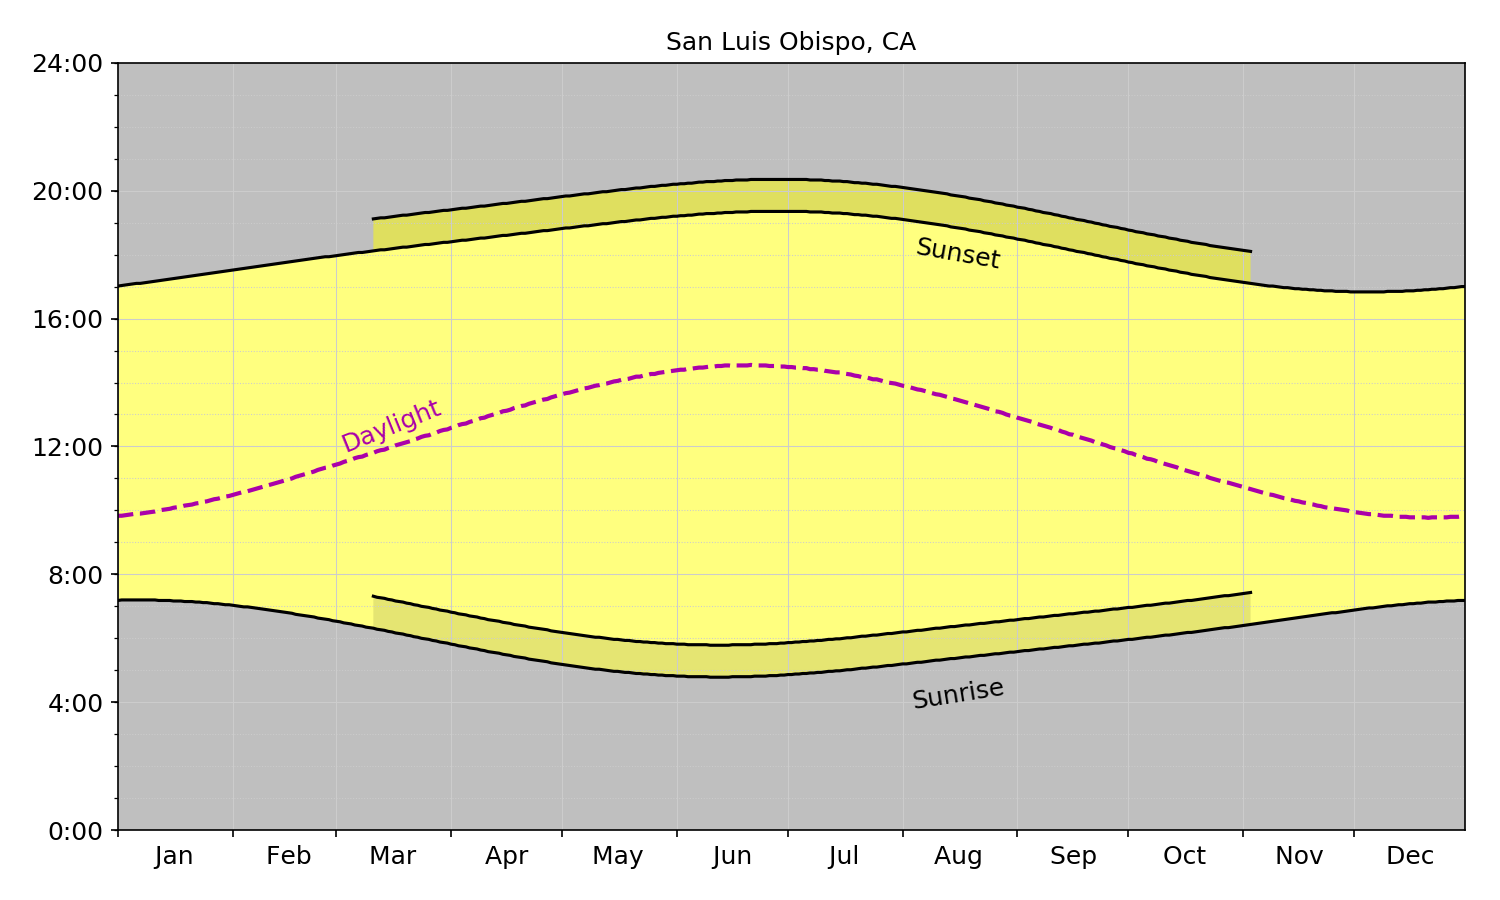
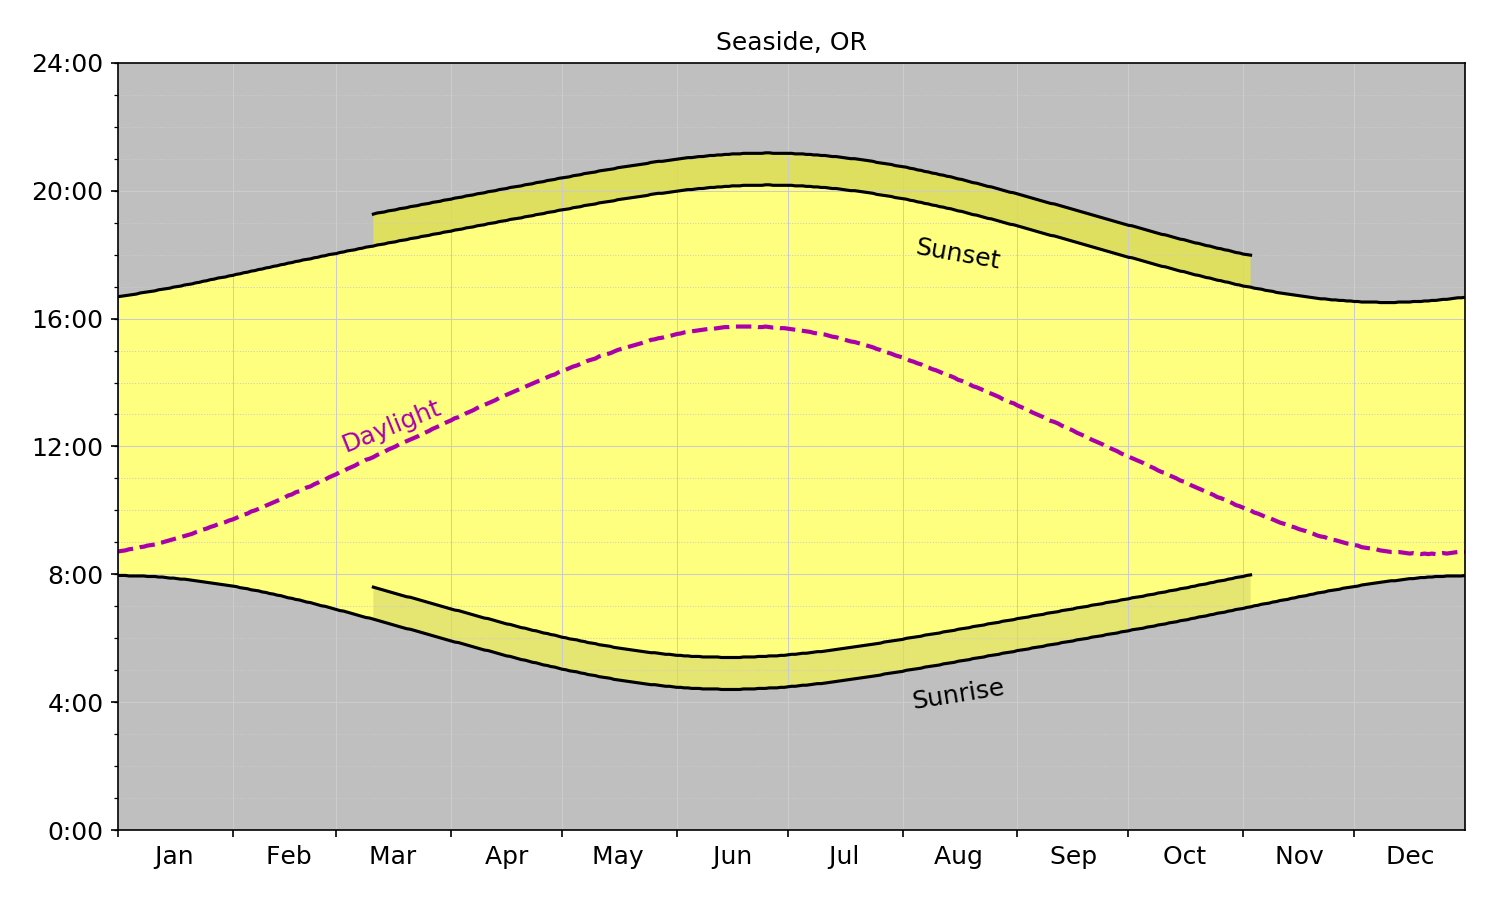
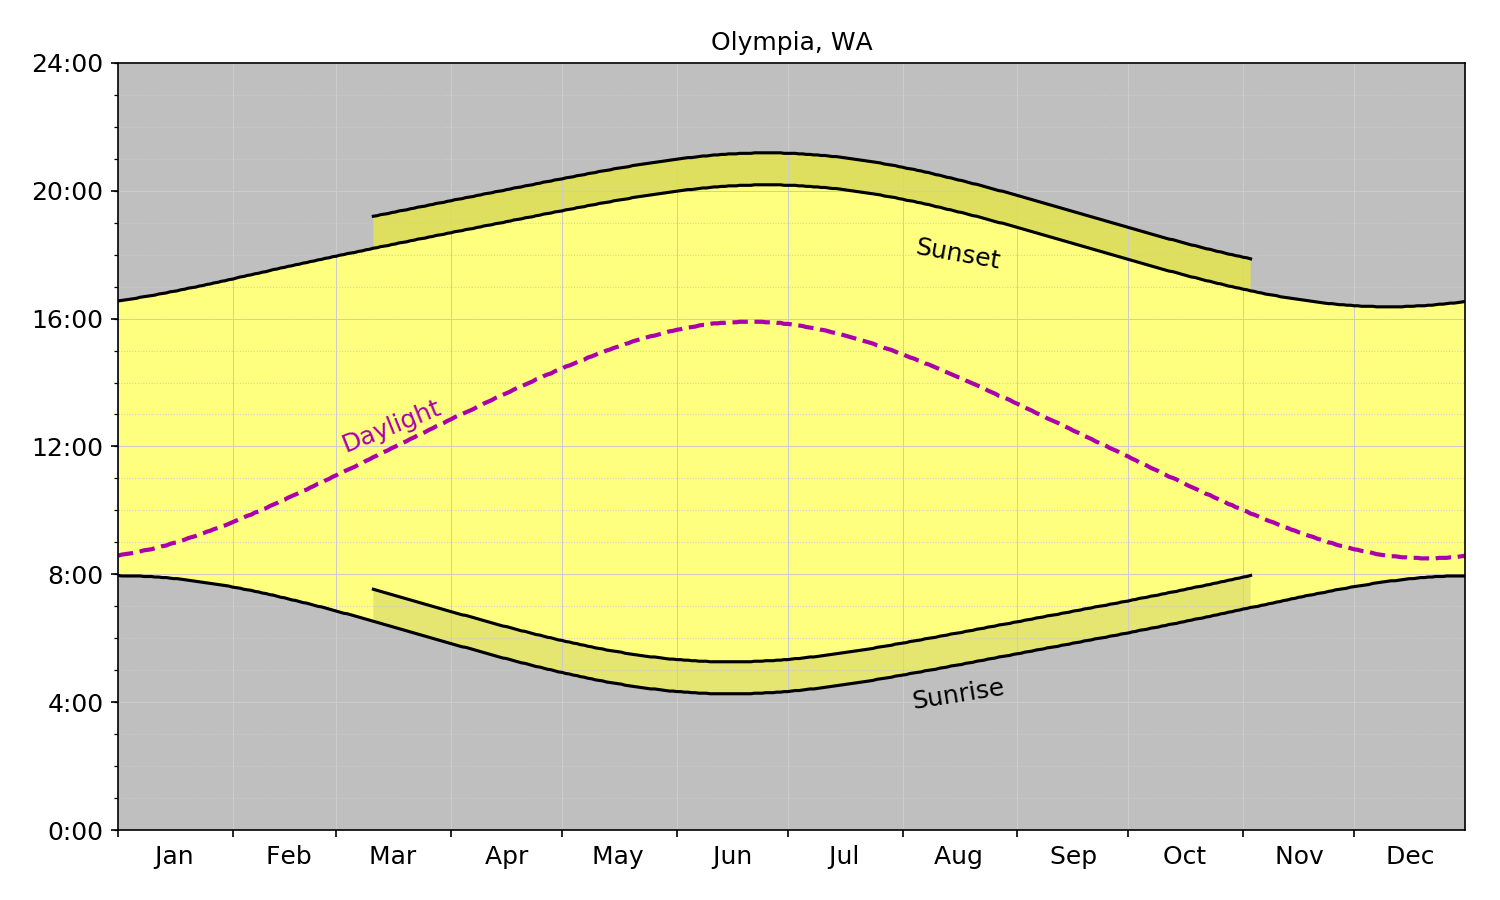
I generated the same graph as Dr. Drang for the following cities:
- Phoenix, AZ
- Eugene, OR
- Portland
- Salem, OR
- Seaside, OR
- Eureka, CA
- Indio, CA
- Long Beach, CA
- Monterey, CA
- San Diego, CA
- San Francisco, CA
- San Luis Obispo, CA
- Ventura, CA
- Ferndale, WA
- Olympia, WA
- Seattle, WA
Why did I pick a city in Arizona? They don’t do Daylight Savings and I wanted to have a comparison of what it’s like for them!
The charts in latitude order (from south to north) are below:
San Diego

Phoenix

Indio

Long Beach

Ventura

San Luis Obispo
Monterey

San Francisco

Eureka

Eugene

Salem

Portland

Seaside
Olympia
Seattle

Ferndale

While these images do show the different impact of Daylight Savings, I think the images are more compelling when shown as a GIF:

We see just how different the impacts of DST are on each city depending on their latitude.
One of Dr. Drang’s main points in support of DST is:
If, by the way, you think the solution is to stay on DST throughout the year, I can only tell you that we tried that back in the 70s and it didn’t turn out well. Sunrise here in Chicago was after 8:00 am, which put school children out on the street at bus stops before dawn in the dead of winter. It was the same on the East Coast. Nobody liked that.
I think that comment says more about our school system and less about the need for DST.
For this whole argument I’m way more on the side of CGP Grey who does a great job of explaining what Day Lights Time is.
I think we may want to start looking at a Universal Planetary time (say UTC) and base all activities on that regardless of where you are in the world. The only reason 5am seems early (to some people) is because we’ve collectively decided that 5am (depending on the time of the year) is either WAY before sunrise or just a bit before sunrise, but really it’s just a number.
If we used UTC in California (where I’m at) 5am would we 12pm. Normally 12pm would be lunch time, but that’s only a convention that we have constructed. It could just as easily be the crack of dawn as it could be lunch time.
Do I think a conversion like this will ever happen? No. I just really hope that at some point in the distant future when aliens finally come and visit us, we aren’t late (or them early) because we have such a wacky time system here.
The LA Marathon
How pretty it was
On Sunday March 18, 2018 I ran the LA Marathon. It was my first one and it was an amazing experience.
I never thought I would be able to compete in, let alone finish, a marathon, but on Sunday I did.
I started training, like really training, for the marathon last August. I would wake up every morning and walk for 45 minutes. This was to get me back into a shape that would allow me to run a bit.
On Sunday, September 24 I completed my first run since February 25th (basically 7 months between runs!). It was a 45 minute run that covered 3.82 miles. Over the next 6 months I slowly increased the distances I would run from that modest 3.82 run up to an 18 mile run. In total, I completed 89 training runs which covered 441.92 miles and spent 79+ hours running (see table below for details).
Month Distance Time Runs September 14.68 3:03:14 4 October 62.96 12:12:05 17 November 87.70 16:52:06 20 December 37.42 7:03:57 7 January 90.80 17:09:12 18 February 69.49 14:16:52 17 March 43.06 08:29:11 6 Total ** 441.92 ** 79:06:37 ** 89**
With all of the training that I did, there was a bit of December where I had pulled my right calf on a training run that forced me to rest for a couple of weeks. The only good news of that was that it coincided with a family trip to Utah where I would not have been able to really run while there (the average day time highs were in the teens and the ground seemed to be constantly covered in ice).
Also, with all of the training that I did, there isn’t really any way to train for race day itself. You get up early (in my case 3:50) and you take a shuttle to the start line and then wait. For hours. I got to Dodger stadium at about 5:00am but the race wasn’t set to start until 6:55am.
So I waited, with my running buddies, for the run to start. It was cold (about 48 degrees) and crowded. Once the race started it took nearly 20 minutes before I was able to cross the start line (there were nearly 25,000 people that ran).
None of the training that you do can really prepare you for this. Even if you do a race during your training, chances are it won’t have that many people, or have that many logistics involved with getting to and starting. That being said, having good company and a good playlist is essential.
I stayed with my coach, Marirose, for the entire race. We ran for the first 15 miles without stopping (except for a potty break at mile 5) and were making pretty good time. For the most part I felt really good.
But then something happened. At about 15 miles I hit a running wall. At 20 miles I hit a walking wall and didn’t want to finish. I think the only reason I finished was because I promised my daughter that I would finish a marathon and I wanted to keep my promise.
At mile 23 all I wanted to do was sit down and take a break, but I kept walking anyway.
Finally, at mile 26 I could see the finish line and Marirose and I ran the last 0.2 miles to the finish line. I had such a wave of emotion.
I kind of wanted to cry. I wanted to cry because I had accomplished an amazing physical feat. I wanted to cry because I hurt EVERYWHERE. I wanted to cry because it was my daughter’s 12 birthday and I was running a marathon and she was home with family friends.
With the wave of emotion and the feeling of having completed such an awesome experience I walked towards the people handing out the medals and got my finisher’s medal.

Now, not only did I have the feeling of completing the LA Marathon, I had a physical manifestation of that feat!
When it was all said and done my unofficial time for the LA Marathon was 05:56:08. Not too shabby for a first timer. Not too shabby for guy who 7 months earlier struggled to run 45 minutes and wasn’t sure he’d ever be able to get past 10 miles.
After the race on Sunday I said I’d never do a marathon again. I had checked it off my bucket list and that was that.
Now, sitting here, only a couple of days later, I’m thinking that never is a long time and that there is a possibility that yes, I might run another marathon.
But not for a while. For now, I’ll stick to my next goal of getting to a sub 25-minute 5k and running a half marathon every year. Those goals seem a little more reasonable, and a little less brutal on my body!
Talk Python Build 10 Apps Review
Michael Kennedy over at Talk Python had a sale on his courses over the holidays so I took the plunge and bought them all. I have been listening to the podcast for several months now so I knew that I wouldn’t mind listening to him talk during a course (which is important!).
The first course I watched was ‘Python Jumpstart by Building 10 Apps’. The apps were:
- App 1: Hello (you Pythonic) world
- App 2: Guess that number game
- App 3: Birthday countdown app
- App 4: Journal app and file I/O
- App 5: Real-time weather client
- App 6: LOLCat Factory
- App 7: Wizard Battle App
- App 8: File Searcher App
- App 9: Real Estate Analysis App
- App 10: Movie Search App
For each app you learn a specific set of skills related to either Python or writing ‘Pyhonic’ code. I think the best part was that since it was all self paced I was able to spend time where I wanted to exploring ideas and concepts that wouldn’t have been available in traditional classrooms.
Also, since I’m fully adulted it can be hard to find time to watch and interact with courses like this so being able to watch them when I wanted to was a bonus.
Hello (you Pythonic) world is what you would expect from any introductory course. You write the basic ‘Hello World’ script, but with a twist. For this app you interact with it so that it asks your name and then it will output ‘Hello username my name is HAL!’ … although because I am who I am HAL wasn’t the name in the course, it was jut the name I chose for the app.
My favorite app to build and use was the Wizard App (app 7). It is a text adventure influenced by dungeons and dragons and teaches about classes and inheritance an polymorphism. It ws pretty cool.
The version that you are taught to make only has 4 creatures and ends pretty quickly. I enhanced the game to have it randomly create up to 250 creatures (some of them poisonous) and you level up during the game so that you can feel like a real character in an RPG.
The journal application was interesting because I finally started to get my head wrapped around file I/o. I’m not sure why I’ve had such a difficult time internalizing the concept, but the course seemed to help me better understand what was going on in terms of file streaming and reading data to do a thing.
My overall experience with the course was super positive. I’m really glad that I watched it and have already started to try to use the things that I’ve learned to improve code I’ve previously written.
With all of the good, there is some not so good.
The course uses it’s own player, which is fine, but it’s missing some key features:
- Time reaming
- Speed controls (i.e. it only plays at one speed, 1x)
In addition, sometimes the player would need to be reloaded which could be frustrating.
Overall though it was a great course and I’m glad I was able to do it.
Next course: Mastering PyCharm!
Setting up ITFDB with a voice
In a previous post I wrote about my Raspberry Pi experiment to have the SenseHat display a scrolling message 10 minutes before game time.
One of the things I have wanted to do since then is have Vin Scully’s voice come from a speaker and say those five magical words, It's time for Dodger Baseball!
I found a clip of Vin on Youtube saying that (and a little more). I wasn’t sure how to get the audio from that YouTube clip though.
After a bit of googling1 I found a command line tool called youtube-dl. The tool allowed me to download the video as an mp4 with one simple command:
youtube-dl https://www.youtube.com/watch?v=4KwFuGtGU6c
Once the mp4 was downloaded I needed to extract the audio from the mp4 file. Fortunately, ffmpeg is a tool for just this type of exercise!
I modified this answer from StackOverflow to meet my needs
ffmpeg -i dodger_baseball.mp4 -ss 00:00:10 -t 00:00:9.0 -q:a 0 -vn -acodec copy dodger_baseball.aac
This got me an aac file, but I was going to need an mp3 to use in my Python script.
Next, I used a modified version of this suggestion to create write my own command
ffmpeg -i dodger_baseball.aac -c:a libmp3lame -ac 2 -b:a 190k dodger_baseball.mp3
I could have probably combined these two steps, but … meh.
OK. Now I have the famous Vin Scully saying the best five words on the planet.
All that’s left to do is update the python script to play it. Using guidance from here I updated my itfdb.py file from this:
if month_diff == 0 and day_diff == 0 and hour_diff == 0 and 0 >= minute_diff >= -10:
   message = '#ITFDB!!! The Dodgers will be playing {} at {}'.format(game.game_opponent, game.game_time)
   sense.show_message(message, scroll_speed=0.05)
To this:
if month_diff == 0 and day_diff == 0 and hour_diff == 0 and 0 >= minute_diff >= -10:
   message = '#ITFDB!!! The Dodgers will be playing {} at {}'.format(game.game_opponent, game.game_time)
   sense.show_message(message, scroll_speed=0.05)
   os.system("omxplayer -b /home/pi/Documents/python_projects/itfdb/dodger_baseball.mp3")
However, what that does is play Vin’s silky smooth voice every minute for 10 minutes before game time. Music to my ears but my daughter was not a fan, and even my wife who LOVES Vin asked me to change it.
One final tweak, and now it only plays at 5 minutes before game time and 1 minute before game time:
if month_diff == 0 and day_diff == 0 and hour_diff == 0 and 0 >= minute_diff >= -10:
   message = '#ITFDB!!! The Dodgers will be playing {} at {}'.format(game.game_opponent, game.game_time)
   sense.show_message(message, scroll_speed=0.05)

if month_diff == 0 and day_diff == 0 and hour_diff == 0 and (minute_diff == -1 or minute_diff == -5):
   os.system("omxplayer -b /home/pi/Documents/python_projects/itfdb/dodger_baseball.mp3")
Now, for the rest of the season, even though Vin isn’t calling the games, I’ll get to hear his voice letting me know, “It’s Time for Dodger Baseball!!!”
- Actually, it was an embarrassing amount ↩︎
HIMSS Day 3
One of the issues that any medium- to large-organization can encounter is how to deal with requests that place a requirement of work from one department to another. Specifically, requests for something shiny and new (especially technology).
In the first educational session of the day, Strategic Portfolio Management: “Governing the Ungoverned” I heard Effie Econompolous discuss UI Health’s transformation from an organization that had very little control over their IT projects to one that has transformed into a highly regulated Project Management Organization.
My key takeaways from this talk were:
- segregation of Projects (with a capital P) from Incidents and Problems
- The IT Roadmap was posted on the intranet for all to see
- Projects that are ‘IT’ related don’t just include the time of resources from IT, but also time and resources from impacted departments throughout the organization
These are some amazing points. My only real question was, If you segregate Projects from Incidents and Problems, how do you ‘train’ users for Project submission. How are they do know the difference between the two (sometimes users aren’t even sure which system is broken when reporting problems in the first place). I’m not sure of the answer, but I’m sure it’s just thought more education and tighter controls over submission of requests.
There was a real time poll during the session which asked, ‘What is the most significant challenge in your organization?’. Fifty percent of attendees that responded indicated inconsistent priorities as the (which is what I answered as well). Turns out, we’re not alone.
A lot of the talk focused on the process that UI Health uses which had gone through 3 iterations in 2 years. It seemed like it would work for a large(ish) hospital or hospital system, but seemed too bureaucratic for my organization.
Overall, a very good talk and I’m glad I went. I believe I have some real actionable ideas that I can take away.
My second educational session of the day Improving Patient Health Through Real-Time ADT Integration I heard about a Managed Medical Group from Minnesota and their journey to get ADT feeds into the Care Management system.
I was hoping to hear something a little more helpful, but while their situation was similar to the one we have at my organization, it was different enough that all I really heard was that, although my organization doesn’t have ADT feeds (yet) we seem to be a bit ahead of them in many other areas of managed care.
The tips that they offered up (getting user buy-in, working through issues with all of the various vendors) were things I had already known would need to be done.
One thing I did hear, that I hope I don’t have to go through, is a ‘Live’ testing process where we get all of the vendors, hospital IT and group IT on the phone to test the system in a ‘Live’ environment to identify deficiencies.
I also hope that any user manual we have to create isn’t 70 pages like the one they have (eeek!!!).
I think it will also be important to have metrics regarding efficiencies before and after any ADT implementations to make sure that we have actually done something helpful for the organization and the member.
My third talk Closed Loop Referral Communications was a bit of a disappointment. A group from North Carolina reviewed how they closed the loop on referral management.
I was hoping for some key insights, but it ended up being mostly about stuff that we had already done (identifying workflow issues, automating where possible) but they still have a fundamental issue with external provider referrals (just like us). I guess I was just hoping that someone would have solved that problem, but if they have, they aren’t sharing the information.
My forth session Breaking Down Barriers with Master Data Management and Data Governance was really interesting and in the same vein as the first talk of the day.
Several good points mentioned during the talk:
- Limited access to data leads to duplication of efforts and numerous sources of the ‘truth’
- If you have Tech and People then you get ‘automated chaos’ ... this is why we NEED process
- Difficult to turn data into actionable information
- Significant barriers to accessing information
- use reference data regarding report creation ... instead of asking the report requester questions, you need domain experts to define various categories (Diabetes, sepsis).
- Best Version of the Truth and Golden Record ... need to review this and see how it applies to DOHC/AZPC
The most astounding thing I heard was that each report costs between \$1k and \$5k to create ... 40% are used 5 times or less! What a source of potential waste that could perhaps be ‘solved’ by self service. We need to have metrics that show not many reports have we created, but instead how many are bing used!
The lessons learned by speaker :
- Governance: keep information at forefront for all front line areas
- Governance: not a one time effort, it’s on-going
- KPI Standardization: requires resilience
- KPI Standardization: processes that work around the system need to be identified and brought into the fold
The fifth talk of the day From Implementation to Optimization: Moving Beyond Operations. Much of what was presented resonated with me and was stuff that we have dealt with. It was nice to know that we’re not alone! The most interesting part of the talk were the 2 polls.
The first one asked, “Do you use an objective tool for prioritization of incoming work?” Most responses were for No, but would be interested (47%); next response was yes but we bypass (32%). Only about 20% have one, use it and it’s effective
The second poll asked, “Do you collaborate with Clinical Stakeholders?” Most responses were yes and split 2-1 between Yes and there’s tension to Yes and we’re equal partners (which is where I think we’re at).
My Last talk of the day, How Analytics Can Create a Culture of Continuous Improvement. It was an interesting talk that focused on using Analytics to drive continuous improvement. Some of the things that really caught my attention were the ideas of implementing continuous improvement is part of the job description. Part of that was something that is stated in the New Employee Orientation, “Do the job you were hired for and make it better.”
Another interesting point was that there is no one Big Bang solution for Emergency Department throughput (though the idea can be applied to any problem you’re facing). You need to look at improving each step a little bit along the way.
But, in order to do this effectively, you need data, team and a process. This reminded me of the Breaking Down Barriers with Master Data Management and Data Governance talk I was at earlier in the day!
It was a great final day at HIMSS.
I’ve learned a ton at this conference and writing about it (like this) has really helped to solidify some thoughts, and make me start asking questions.
I’ll need to remember to do this at my next conference.
Page 18 / 24